Content
Published:
This is an archived release.
NOK 95 billion in current account surplus
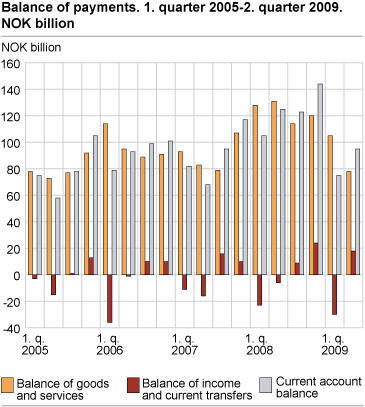
According to preliminary figures, the current account surplus was NOK 95 billion in the first quarter of 2009, down NOK 30 billion from the second quarter of 2008.
Reduced balance of goods and services surplus
The balance of goods and services was NOK 78 billion in the second quarter of 2009, down NOK 54 billion compared to the second quarter last year.
The surplus in the balance of trade in goods was NOK 64 billion, compared to NOK 117 billion in the second quarter of 2008. The weakening was mainly due to a substantial fall in prices of international oil and natural gas prices, resulting in a drop in income from exports of oil and gas of almost NOK 59 billion. Norway’s export of goods in total came to NOK 173 billion, representing a decline of 31 per cent from the second quarter in 2008. The value of imported goods was NOK 109 billion, down 17 per cent compared to the second quarter of 2008.
Trade in services generated a surplus of NOK 14 billion in the second quarter of 2009. Exports of services amounted to NOK 64 billion, down NOK 4 billion or 6 per cent from the second quarter the previous year. Imports of services fell from NOK 54 billion to NOK 50 billion.
Net income account surplus
There was a positive net balance of income and current transfers of NOK 18 billion in the second quarter of 2009, compared to a deficit of NOK 6 billion in the same quarter in 2008. The improvement can largely be explained by a rise in net dividends paid from abroad.
Financial account
According to the financial account, Norwegian net assets abroad increased by NOK 282 billion in the second quarter of 2009. About two-thirds of the increase was due to positive revaluations of the positions, thus to a large extent catching up with the substantial losses experienced in the first quarter.
Norwegian investments abroad were negative by NOK 29 billion in the second quarter of 2009, while non-residents' investments in Norway were negative by NOK 180 billion in the same period. There was an increase in both inward and outward direct investments. Portfolio investments abroad were negative, while non-residents’ portfolio investments in Norway were positive.
| 2007 | 2008 | 1. quarter 2007 | 2. quarter 2007 | 3. quarter 2007 | 4. quarter 2007 | 1. quarter 2008 | 2. quarter 2008 | 3. quarter 2008 | 4. quarter 2008 | 1. quarter 2009 | 2. quarter 2009 | ||||||||||||||||||||||||||||
|---|---|---|---|---|---|---|---|---|---|---|---|---|---|---|---|---|---|---|---|---|---|---|---|---|---|---|---|---|---|---|---|---|---|---|---|---|---|---|---|
| Balance of goods and services | 363 | 493 | 93 | 83 | 79 | 107 | 128 | 131 | 114 | 120 | 105 | 78 | |||||||||||||||||||||||||||
| Balance of income and current transfers | -1 | 3 | -11 | -16 | 16 | 10 | -23 | -6 | 9 | 24 | -30 | 18 | |||||||||||||||||||||||||||
| Current account balance | 362 | 496 | 82 | 68 | 95 | 117 | 105 | 125 | 122 | 144 | 75 | 95 | |||||||||||||||||||||||||||
| Capital transfers etc. to abroad, net | 1 | 1 | 0 | 1 | 0 | 0 | 0 | 0 | 1 | 0 | 0 | 1 | |||||||||||||||||||||||||||
| Net lending | 361 | 495 | 82 | 67 | 95 | 117 | 104 | 125 | 122 | 144 | 74 | 95 | |||||||||||||||||||||||||||
| Direct investment, net | 65 | 160 | 33 | 8 | 38 | -13 | 38 | 11 | 72 | 37 | 30 | 40 | |||||||||||||||||||||||||||
| Portifolio investment, net | 130 | 641 | 1 | -57 | 180 | 5 | 136 | 81 | 215 | 211 | 93 | 35 | |||||||||||||||||||||||||||
| Other investment, net | 166 | -305 | 48 | 116 | -123 | 125 | -70 | 34 | -165 | -104 | -49 | 20 | |||||||||||||||||||||||||||
| Revaluations, net | -178 | -132 | -61 | -60 | -68 | 11 | -80 | -116 | 77 | -12 | -231 | 187 | |||||||||||||||||||||||||||
| Increase in Norway`s net assets | 183 | 363 | 21 | 7 | 27 | 129 | 25 | 9 | 199 | 132 | -156 | 282 | |||||||||||||||||||||||||||
Quarterly balance of payments data for the period 1994-2009 are available in StatBank Norway .
Additional information
For more information about price and volume growth of exports and imports, see the quarterly national accounts.
More details about exports and imports of goods and services are available in the statistics on external trade in goods and services.
Contact
-
Håvard Sjølie
E-mail: havard.sjolie@ssb.no
tel.: (+47) 40 90 26 05
-
Linda Wietfeldt
E-mail: linda.wietfeldt@ssb.no
tel.: (+47) 40 90 25 48

