Content
Published:
This is an archived release.
Decline in exports of services
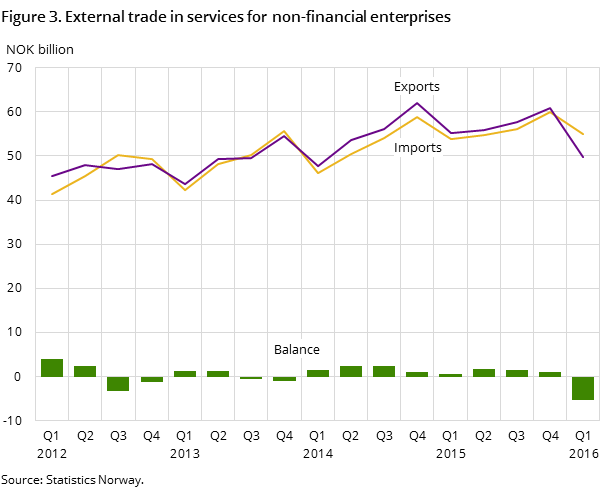
Exports of services in the 1st quarter of 2016 went down by 10 per cent compared to the 1st quarter of 2015, while imports of services were unchanged.
| 1st quarter 2016 | Change in per cent | ||
|---|---|---|---|
| 4th quarter 2015 - 1st quarter 2016 | 1st quarter 2015 - 1st quarter 2016 | ||
| Exports | 49 785 | -21.5 | -10.2 |
| Imports | 55 059 | -14.7 | 0.3 |


Exports of services amounted to a total of NOK 50 billion in the 1st quarter of 2016, compared to NOK 55 billion in the 1st quarter of 2015. Compared to the 4th quarter of 2015, this was a decrease in exports of NOK 14 billion in the 1st quarter of 2016, equivalent to a reduction of 22 per cent. Imports of services amounted to NOK 55 billion in the 1st quarter of 2016, the same as in the 1st quarter of 2015. In the 1st quarter of 2016 the imports of services dropped by NOK 9 billion, or 15 per cent, compared to the 4th quarter of 2015.
Services related to sea and coastal transport dominate exports of services
Services related to sea and coastal transport dominated with 37.7 per cent of the total exports in the 1st quarter of 2016, which corresponds to approximately NOK 19 billion. Compared to the 4th quarter of 2015, this corresponds to a decrease of 16.2 per cent, and compared to the 1st quarter of 2015 is a decline of 10.5 per cent.
Business and professional and technical services is still the second largest export group, and amounted to about NOK 9 billion in the 1st quarter of 2016, equivalent to 17.3 per cent of the total exports. Compared to the 4th quarter of 2015, this group of services went down by 25.3 per cent, and declined 19.7 per cent compared to the 1st quarter of 2015.
Three groups of services accounted for about half of all imports
The largest service group in the 1st quarter of 2016 was business, professional and technical services. This group accounted for about NOK 9 billion, equivalent to 17 per cent of the total imports of services. Services related to oil and gas exploration excluding surveying amounted to NOK 8 billion, equivalent to 15 per cent of total imports. Services related to supporting and auxiliary transport activities and travel agency activities accounted for 14 per cent of total imports, with about NOK 8 billion.
Compared to the 4th quarter of 2015, business, professional and technical services decreased by 21.3 per cent, and compared to the 1st quarter of 2015 decreased by 10.8 per cent. Imports of services related to oil and gas exploration, excluding surveying, showed a decline of 23.8 per cent compared to the 4th quarter of 2015, and a decline of 3.8 per cent set against the 1st quarter of 2015. Imports of services related to supporting and auxiliary transport activities and travel agency activities went down by 13.4 per cent compared to the 4th quarter of 2015 and 7 per cent compared to the 1st quarter of 2015.
Trade with Europe still important
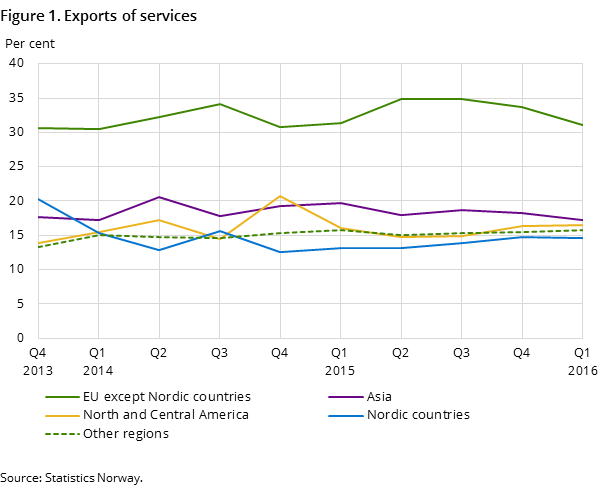
European countries received approximately 50 per cent of the services exported by Norwegian non-financial enterprises in the 1st quarter of 2016, equivalent to about NOK 25 billion. The EU excluding Nordic countries accounted for 31.1 per cent of Norwegian exports, equivalent to about NOK 16 billion. Nordic countries received 14.6 per cent, about NOK 7 billion.
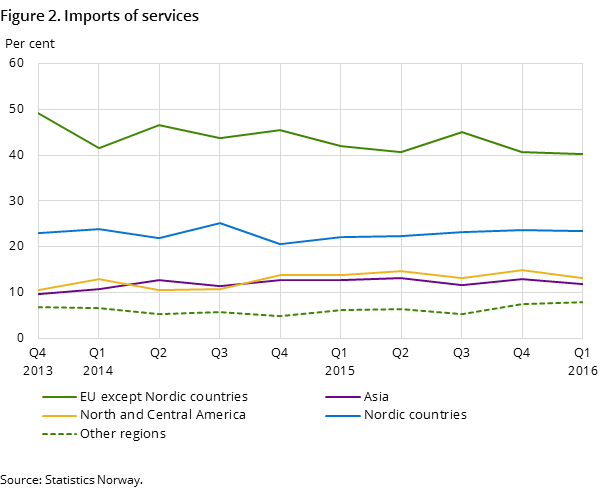
Approximately 66 per cent of total imports of services in the 1st quarter of 2016, equivalent to roughly NOK 37 billion, came from European countries. The EU excluding Nordic countries accounted for about NOK 22 billion of these imports. About NOK 13 billion worth of the services were imported from Nordic countries.
Contact
-
Noel Hoven
E-mail: noel.hoven@ssb.no
tel.: (+47) 40 78 13 37
-
Jonathan Ho
E-mail: jonathan.ho@ssb.no
tel.: (+47) 40 90 25 82
-
Anne Lyslid Larsen
E-mail: anne.larsen@ssb.no
tel.: (+47) 40 90 23 31
-
Ayfer Erbaydar Storrud
E-mail: ayfer.storrud@ssb.no
tel.: (+47) 97 78 71 85
-
Thomas Moen
E-mail: thomas.moen@ssb.no
tel.: (+47) 93 49 40 32
