Content
Published:
This is an archived release.
Increase in monthly price
The mean monthly prices for the national level continue to increase for all age groups. In ordinary kindergartens, the monthly price for 0-2 year-olds increased from NOK 14 522 in 2009 to NOK 15 062 in 2010.
The 2010 figures for ordinary kindergartens show that kindergartens in Sogn og Fjordane and Nordland had the lowest costs. Monthly costs for 0-2 year-olds there were NOK 14 287, and were highest in Aust-Agder without Svalbard at NOK 16 473. The national level for family day-care for 0-2 year-olds was NOK 10 741. Family day-care costs were lowest in Sør-Trøndelag, with NOK 7 695, and the highest was in Møre og Romsdal with NOK 12 366.
Hourly costs increased
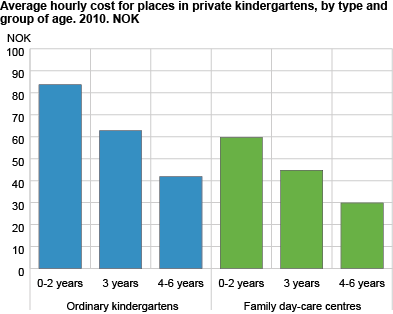
In ordinary kindergartens the hourly costs for 0-2 year-olds increased from NOK 80.68 in 2009 to NOK 83.68 in 2010. Hourly costs for 3 year-olds increased from NOK 60.51 in 2009 to NOK 62.76 in 2010, and for 4-6 year-olds from NOK 40.34 to NOK 41.84.
The increase in hourly costs was the same in family day-care centres. The hourly costs for 0-2 year-olds increased from NOK 57.95 to NOK 59.67, for 3 year-olds from NOK 43.46 to NOK 44.76 and for 4-6 year-olds from NOK 28.98 to NOK 29.84.
Less parental payment and higher municipal subsidies
Parental payments accounted for 19 per cent of gross operating expenditures in private kindergartens in 2010, compared to 20 per cent in 2009. This follows the trend from last year whereby state and municipal subsidies account for an increasing share of kindergartens’ revenues. State subsidies accounted for 60 per cent of gross operating expenditures, whereas municipal subsidies accounted for 23 per cent in 2010.
Tables:
- Table 1 Accounts statistics for private kindergartens. Kindergartens, by type of kindergarten and revenue in per cent of gross expenditures. County. 2010
- Table 2 Average hourly cost for places in private kindergartens, by type of kindergarten and groups of age. County 2010. NOK
- Table 3 Private ordinary kindergartens. Monthly costs for a place in kindergarten by hours of attendance per week and different age groups. County. 2010. NOK
- Table 4 Private family day-care centres. Monthly costs for a place in kindergarten by hours of attendance per week and different age groups. County. 2010. NOK
Contact
-
Elisabeth Haraldsrud
E-mail: elisabeth.haraldsrud@ssb.no
tel.: (+47) 40 81 15 00
-
Per Torstein Tuhus
E-mail: per.torstein.tuhus@ssb.no
tel.: (+47) 40 81 13 49
-
Johannes Bennetzen
E-mail: johannes.bennetzen@ssb.no
tel.: (+47) 98 47 99 44

