Content
Published:
This is an archived release.
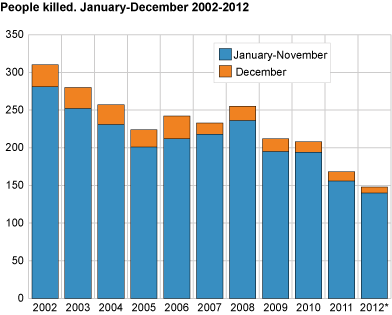
148 traffic fatalities in 2012; lowest since 1950
In 2012, 148 persons were killed in road traffic accidents. This is the lowest number since 1950. By comparison, 560 persons were killed in traffic accidents in 1970; the highest number ever. Eight persons lost their lives in December.
In the 10-year period 2002-2011, there was an average of 239 fatalities every year. In 2011, 168 persons lost their lives.
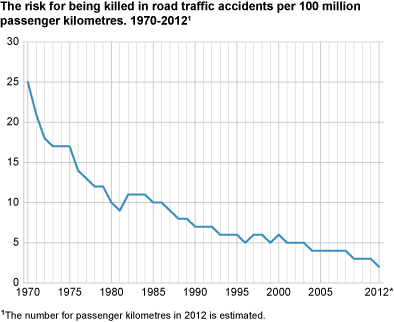

Strong increase in traffic, substantial reduction in traffic safety
Since 1970, the number killed in traffic has been reduced by almost 75 per cent. At the same time, the traffic has increased by 200 per cent.
The risk of being killed in a road traffic accident was consequently reduced substantially after 1970. While 25 persons were killed in traffic accidents per 100 million passenger kilometres in 1970, the number was reduced to approximately two in 2012.
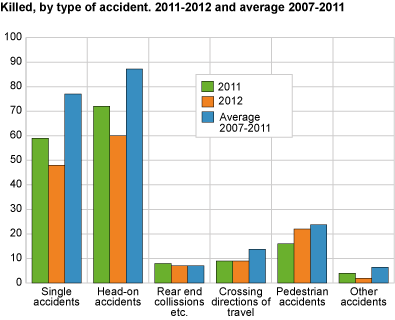
Mostly head-on-collisions and single accidents
A total of 60 out of the 148 persons that were killed in 2012 lost their lives in head-on collisions, while 48 were killed in accidents where the vehicle left the road.
Almost 50 per cent of those killed were car drivers
In 2012, preliminary figures show that 69 car drivers died in the traffic, which is 47 per cent of all traffic fatalities. The corresponding figures for 2011 were 87 fatalities and 52 per cent. Of the other road users that lost their lives in 2012, 19 were car passengers, 22 were drivers of motorcycles or mopeds, 12 were bicyclists and 4 were in the category other road users. Twenty-two passengers were killed in traffic accidents in 2012; six more compared to 2011.
Large number of youths killed in traffic accidents
In the age group 20-24 years, 27 persons were killed in road traffic accidents in 2012. This is a reduction of six compared to 2011. Four children under 16 years of age lost their lives, compared to seven in 2011.
No fatalities in Finnmark county
The preliminary figures show that no one was killed in traffic accidents in Finnmark county in 2012. As in 2011, Hordaland county had the highest number of fatalities, with 15 persons in total. The number killed in Akershus doubled from 2011, from 6 to 12. In Oppland county, the number of fatalities was reduced by 10, from 18 to 8.
Eight killed in road traffic in December
In December, eight people died in road traffic accidents, according to preliminary figures. The corresponding figure for December 2011 was 12.
Police figuresThe statistics are based on accidents reported to the police. Less severe accidents and injuries are often not reported to the police, and may therefore be underrepresented in the figures. The total number of injuries includes casualties where the degree of injury has not been specified. Around 24 per cent of the casualties reported so far this year belonged to this category. Some people registered in this category may be uninjured, and figures are subject to change. Due to new registration routines by the Police from November 2012, the number of injured persons is particularly uncertain for November and December. Comparisons with previous months should be interpreted with caution. |
Tables:
- Table 1 People killed or injured in road traffic accidents, by month 2009-2012
- Table 2 People killed or injured in road traffic accidents, by county 2011-2012
- Table 3 People killed or injured in road traffic accidents, by police force area 2011-2012
- Table 4 People killed or injured in road traffic accidents, by degree of injury, sex and age. January-December 2012
- Table 5 People killed or injured in road traffic accident, by degree of injury, sex and group of road user. January-December 2012
- Table 6 People killed or injured in road traffic accidents, by degree of injury, sex and accident type. January-December 2012
Contact
-
Bente Elisabeth Andresen
E-mail: bente.elisabeth.andresen@ssb.no
tel.: (+47) 40 81 13 84