Content
Published:
This is an archived release.
Fewer killed and injured in 2009
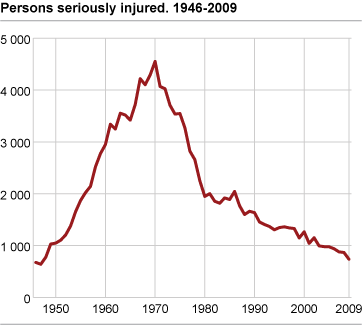
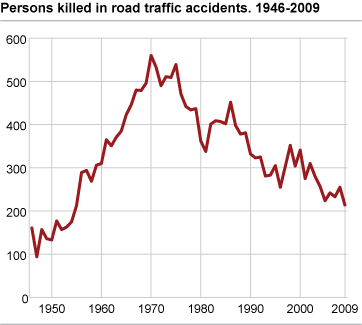
A total of 214 people were killed on Norwegian roads in 2009, and 738 people were seriously injured. Seventeen people lost their lives in December.
41 fewer fatalities in 2009
A total of 214 people were killed in road traffic accidents in 2009. This compares with 255 killed in 2008. The average figure for the 10-year period 2000-2009 shows that 263 were killed.
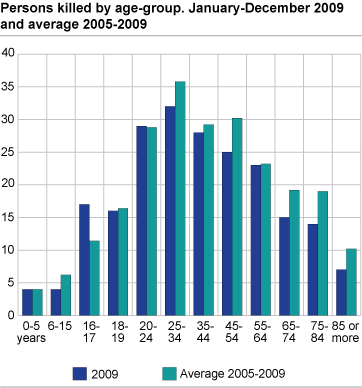
More killed in the age group 16-17
Seventeen people in the age group 16-17 years were killed in 2009, compared to 6 in 2008. The average figure for the period 2005-2009 was 11 fatalities. The number of persons killed has increased or been unchanged for the youngest people (16-24 years) compared to the last 5-year period, while there has been a reduction for the other age groups.
Fewer drivers killed, more car passengers killed
Compared to the 5-year period 2005-2009 there has been a reduction in the number killed for all road user groups except for car passengers. In total, 47 car passengers and 98 car drivers were killed in 2009, compared with 46 and 123 respectively in 2008. Of the others killed in 2009, 27 were motorcyclists, 25 pedestrians, 9 cyclists, 2 moped drivers, 1 person on a sledge and 5 other road users.
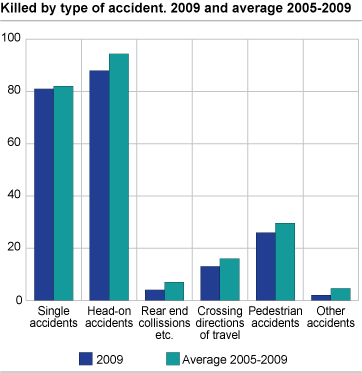
No reduction in fatalities caused by head-on collisions
A total of 88 out of the 214 persons that were killed in 2009 lost their lives in head-on collisions (41 per cent), while 81 were killed in single accidents (38 per cent). The figures for 2008 were 88 and 102 respectively.
The December traffic
Preliminary figures show that 524 road traffic accidents were reported to the Norwegian police in December 2009. Seventeen people were killed and 777 were injured in these accidents. In December 2008, the number of fatalities amounted to 20 and 678 people were injured. Among the 17 people killed in road traffic accidents last month, 10 were drivers of cars, six were car passengers and one was a pedestrian.
Police figuresThe statistics are based on accidents reported to the police. Less severe accidents and injuries are often not reported to the police and may therefore be underrepresented in the figures. The total number of injuries includes casualties where the degree of injury has not been specified. Around 21 per cent of the casualties reported thus far in 2009 belonged to this category. Some people registered in this category may be uninjured, and figures are subject to change. |
Tables:
- Table 1 People killed or injured in road traffic accidents, by month 2006-2009
- Table 2 People killed or injured in road traffic accidents, by county 2008-2009
- Table 3 People killed or injured in road traffic accidents, by police force area 2008-2009
- Table 4 People killed or injured in road traffic accidents, by degree of injury, sex and age. January-December 2009
- Table 5 People killed or injured in road traffic accident, by degree of injury, sex and group of road user. January-December 2009
- Table 6 People killed or injured in road traffic accidents, by degree of injury, sex and accident type. January-December 2009
- Table 7 People killed or injured in road traffic accidents, by municipality. January-December 2008-2009
Contact
-
Bente Elisabeth Andresen
E-mail: bente.elisabeth.andresen@ssb.no
tel.: (+47) 40 81 13 84