Content
Published:
This is an archived release.
Fewer road traffic accidents
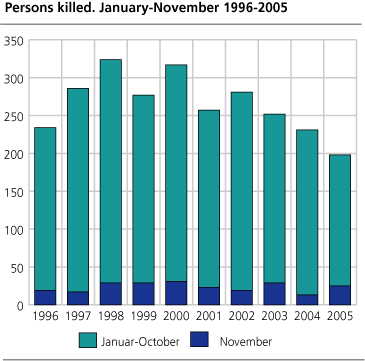
A total of 198 people were killed in road traffic accidents so far this year. The number fatalities in the period January-November 2005 was the lowest since the first time the monthly statistics of accidents were registered in 1968. Of the 198 fatalities 25 were killed in November.
A total of 198 people were killed on Norwegian roads from January to November 2005, while the comparative figure for the same period last year came to 231 people.
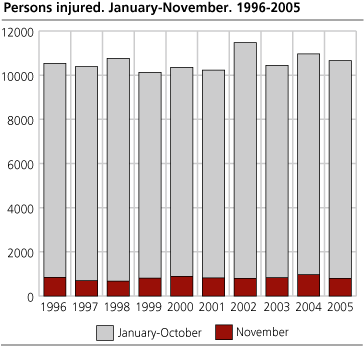
A total of 10 655 people were injured in the first eleven months this year compared with 10 970 in the same period in 2004. Average figures for the period 2001-2005 show that 244 people were killed and 10 755 injured.
25 killed in November
A total of 583 road traffic accidents were reported to the Norwegian police in November. 25 people were killed and 795 were injured in these accidents. Comparative figures for November last year show that 13 people were killed and 967 injured on Norwegian roads, while the average figures for the period 2001-2005 are 22 fatalities and 843 injuries in November.
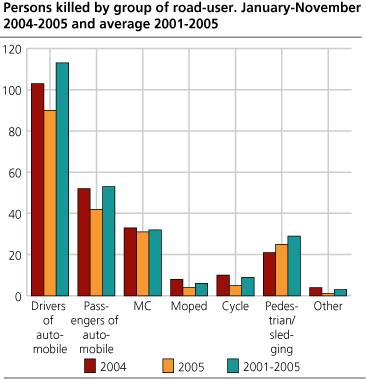
Among the 25 people killed in road traffic accidents last month, eleven were drivers of cars, seven were car passengers, two were motorcyclists and five were pedestrians.
Police figures
The statistics are based on accidents reported to the police. Less severe accidents and injuries are therefore under-represented in the figures. In addition, the total number of injuries includes casualties where the degree of injury has not been specified. Future figures may prove that there was no injury.
The figures for 2004 that are used for comparative purposes in this text are preliminary. The 2004 figures presented in tables 1-10 are final.
Tables:
- Table 1 Persons killed or injured in road traffic accidents, by month
- Table 2 Persons killed or injured in road traffic accidents, by county
- Table 3 Persons killed or injured in road traffic accidents, by police force area
- Table 4 Persons killed or injured in road traffic accidents, by age and mode of transport. January-November
- Table 5 Persons killed or injured in road traffic accidents, by severity, mode of transport and sex. January-November
- Table 6 Persons killed or injured in road traffic accidents, by mode of transport and type of accident. January-November
- Table 7 Drivers of automobile killed or injured in road traffic accidents, by age and type of accident. January-November
- Table 8 Persons killed or injured in road traffic accidents, by traffic units. January-November
- Table 9 Persons killed or injured in road traffic accidents involving lorries, by month
- Table 10 Vehicles involved in road traffic accidents, by type of tyres and accident. November
Contact
-
Bente Elisabeth Andresen
E-mail: bente.elisabeth.andresen@ssb.no
tel.: (+47) 40 81 13 84


