Content
Published:
This is an archived release.
15 fatalities and 937 injured in October
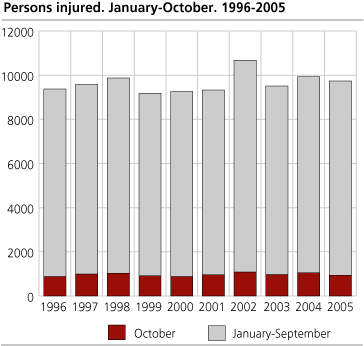
A total of 669 road traffic accidents were reported to the Norwegian police in October. 15 people were killed and 937 were injured in these accidents, according to preliminary figures.
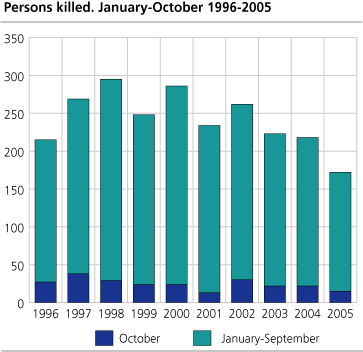
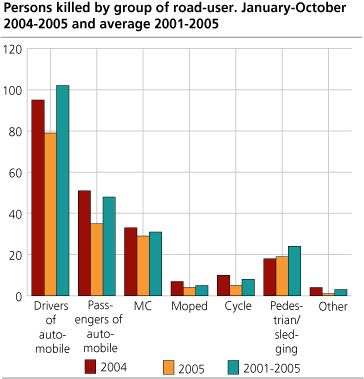
In October 2004 the number of fatalities amounted to 22 while 1 048 were injured. Figures for the ten-year period show that 24 were killed and 972 injured on average in October road traffic accidents. Among the 15 people killed in road traffic accidents last month, seven were drivers of cars, two were car passengers, four were motorcyclists and two were pedestrians.
172 killed so far this year
172 people have been killed and 9 742 people have been injured in road traffic accidents so far this year. This compares with 218 killed and 9 929 injured in the same period last year. The average figure from 1996-2005 show that 242 were killed and 9 646 were injured in the same period.
Fewer drivers and car passengers injured
The preliminary figures from January to October show that 4 643 drivers of cars and 2 534 car passengers were injured. This is 45 and 94 fewer than in the same period last year.
Fewer mopedists injured
561 people on moped were injured so far this year, 104 fewer than last year.
Police figures
The statistics are based on accidents reported to the police. Less severe accidents and injuries are therefore under-represented in the figures. In addition, the total number of injuries includes casualties where the degree of injury has not been specified. Future figures may prove that there was no injury.
The figures for 2004 that are used for comparative purposes in this text are preliminary. The 2004 figures presented in tables 1-10 are final.
Tables:
- Table 1 Persons killed or injured in road traffic accidents, by month
- Table 2 Persons killed or injured in road traffic accidents, by county
- Table 3 Persons killed or injured in road traffic accidents, by police force area
- Table 4 Persons killed or injured in road traffic accidents, by age and mode of transport. January-October
- Table 5 Persons killed or injured in road traffic accidents, by severity, mode of transport and sex. January-October
- Table 6 Persons killed or injured in road traffic accidents, by mode of transport and type of accident. January-October
- Table 7 Drivers of automobile killed or injured in road traffic accidents, by age and type of accident. January-October
- Table 8 Persons killed or injured in road traffic accidents, by traffic units. January-October
- Table 9 Persons killed or injured in road traffic accidents involving lorries, by month
- Table 10 Vehicles involved in road traffic accidents, by type of tyres and accident. October
Contact
-
Bente Elisabeth Andresen
E-mail: bente.elisabeth.andresen@ssb.no
tel.: (+47) 40 81 13 84


