Content
Published:
This is an archived release.
22 killed in October
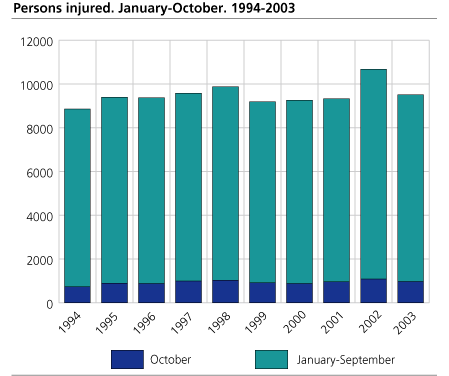
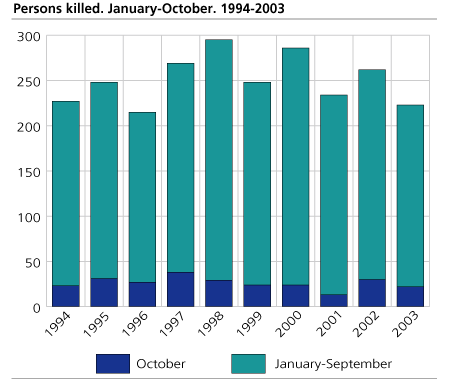
A total of 678 road traffic accidents were reported to Norwegian police in October. 22 people lost their lives and 973 were injured in these accidents, according to preliminary figures.
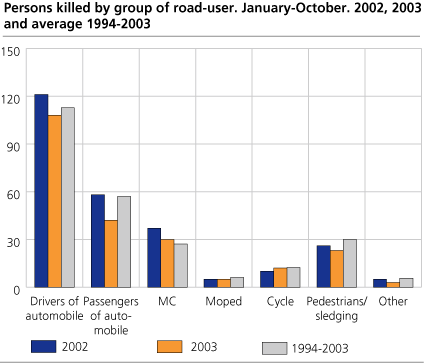
The figures for October last year show that 30 people were killed and 1 090 injured on Norwegian roads. The average figures for the ten-year period 1994-2003 are 26 fatalities and 936 injuries in October traffic. Of the 22 people killed in road traffic accidents last month, 11 were drivers of automobiles, one was passenger of automobiles, one was motorcyclists, three were mopedallists and six were pedestrians.
Fewer killed so far
The preliminary figures show that 223 people have lost their lives and 9 510 have been injured on Norwegian roads so far this year. The comparative figures for last year were 262 people killed and 10 672 injured. The average figures for the period 1994-2003 are 251 people killed and 9 504 injured in the first ten months of the year.
Police figures
The statistics are compiled from returns made by police authorities. Less severe accidents and injuries are therefore under-represented in the figures.
The preliminary injury figures for October 2003 that are used for comparative purposes in this text and figures presented in the tables 1-8 are compared with final figures for the same period in 2002.
Tables:
- Table 1 Persons killed or injured in road traffic accidents, by month
- Table 2 Persons killed or injured in road traffic accidents, by county
- Table 3 Persons killed or injured in road traffic accidents, by police force area
- Table 4 Persons killed or injured in road traffic accidents, by age and mode of transport. January-October
- Table 5 Persons killed or injured in road traffic accidents, by severity and mode of transport. January-October
- Table 6 Persons killed or injured in road traffic accidents, by mode of transport and type of accident. January-October
- Table 7 Vehicles involved in road traffic accidents, by type of tyres and accident. January-October
- Table 8 Persons killed or injured in road traffic accidents, by mode of transport. January-October
- Table 9 Persons killed or injured in road traffic accidents involving lorries, by month
Contact
-
Bente Elisabeth Andresen
E-mail: bente.elisabeth.andresen@ssb.no
tel.: (+47) 40 81 13 84


