Content
Published:
This is an archived release.
Increase in road traffic fatalities
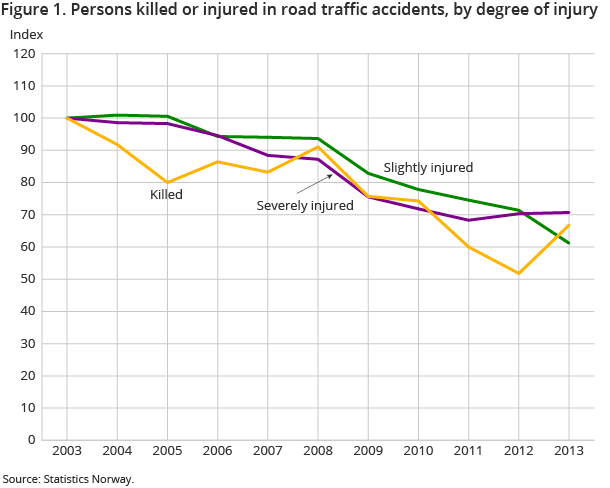
There were 170 fatal accidents on Norwegian roads in 2013, with a total of 187 fatalities. This ended the positive trend of decreasing numbers of fatalities over the last 5 years.
| 2013 | Average last 5 years | |||
|---|---|---|---|---|
| Killed | Severely injured | Killed | Severely injured | |
| Total | 187 | 703 | 184 | 709 |
| Males | 135 | 443 | 137 | 468 |
| Females | 52 | 260 | 47 | 241 |
| Group of road user | ||||
| Drivers of car | 99 | 260 | 92 | 288 |
| Passengers of car | 31 | 113 | 34 | 147 |
| Drivers and passengers on motorcycle and moped | 24 | 129 | 23 | 115 |
| Cyclists, pedestrians and persons sledging | 28 | 190 | 31 | 147 |
| Others | 5 | 11 | 4 | 12 |
| Age | ||||
| 0-15 years | 5 | 44 | 6 | 45 |
| 16-24 years | 34 | 142 | 41 | 174 |
| 25-44 years | 42 | 210 | 50 | 220 |
| 45-64 years | 62 | 207 | 50 | 176 |
| 65 years or older | 44 | 98 | 37 | 92 |
| Unknown age | 0 | 2 | 0 | 2 |


The average number of fatalities for the 10-year period 2004-2013 was 213.
2 out of 3 were car drivers or passengers
A total of 130 out of 187 persons who were killed in the traffic last year were either drivers or passengers in a car. This corresponds to 70 per cent of all traffic fatalities. In 2012, the percentage was 59 (86 persons).
The number of persons killed on motor cycles increased by 4 to 21 in total. Sixteen pedestrians were killed; 5 less than in 2012. The number of cyclists killed was 10; 2 less than the year before.
Number seriously injured remains stable
In 2013, 703 persons were seriously injured in road traffic accidents, compared to 699 in 2012. The average over the period 2004 to 2013 was 819 seriously injured per year.
1 out of 3 aged 45-64 years old
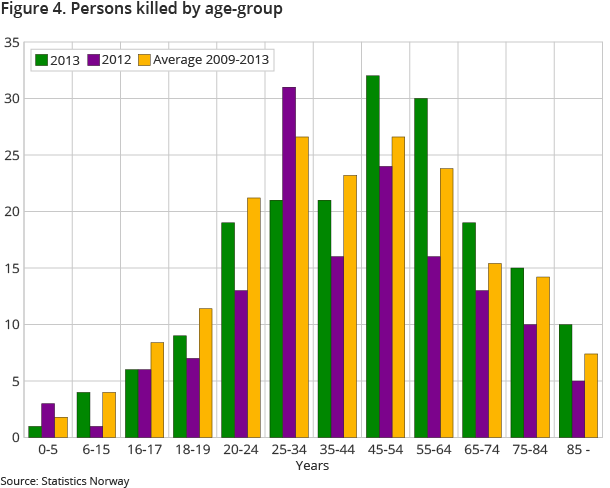
In 2013, 62 persons in the age group 45-64 years were killed in road traffic accidents, compared to 40 in 2012. This was 33 per cent of all fatal accidents. The corresponding share in 2912 was 28 per cent. In the age group 25-34 years, the number of fatalities was reduced from 31 to 21.
Head-on collisions and run-off-the road accidents claim lives
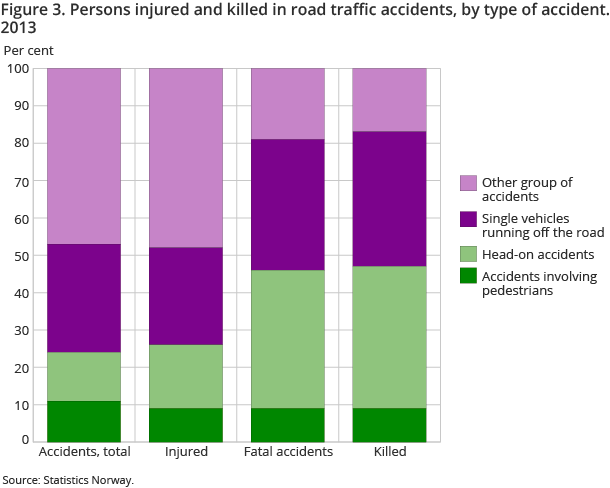
A total of 71 persons were killed in head-on collisions in 2013. Sixty-seven persons were killed in run-off-the-road accidents. In total, these two types of accident accounted for 72 per cent of all fatalities in 2013; about the same as the year before.
Most killed in traffic accidents in Buskerud and Rogaland
Hordaland and Rogaland each had 19 traffic fatalities in 2013.
Most serious accidents outside densely populated areas
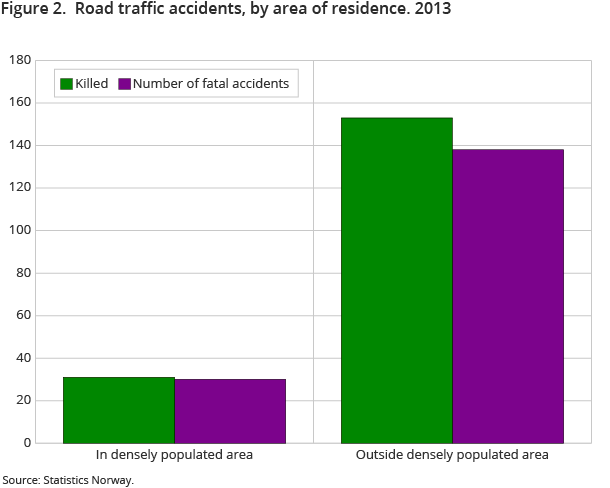
A total of 153 persons, corresponding to 82 per cent, lost their lives outside densely populated areas in 2013. Thirty-one persons were killed in accidents within densely populated areas.
Very low exposure risk in Sweden
In Sweden, the exposure risk was 2.7, counted as fatalities per 100 000 inhabitants. In Norway, the number of fatalities per 100 000 inhabitants was 3.7 in 2013. Preliminary figures for Denmark and Finland were 3.2 and 4.6 persons respectively. By way of comparison, the corresponding figure for Norway in 1970 was 14.5 fatalities per 100 000 inhabitants
Decreasing figures in the EU
The exposure risk in the EU-28 was reduced from 6.1 fatalities per 100 000 population in 2011 to 5.6 in 2012. The total number of persons killed in road traffic accidents in the EU-28 was 28 000 in 2012.
Contact
-
Bente Elisabeth Andresen
E-mail: bente.elisabeth.andresen@ssb.no
tel.: (+47) 40 81 13 84
