Content
Published:
This is an archived release.
Increase in transport of passengers and goods
The overall transport work increased by 2.1 per cent in 2008 to 72.4 billion passenger kilometres. The transport of goods increased by 2.7 per cent from 2007-2008 to 66.6 billion tonne-kilometres.
Both the public and the private transport contributed to the growth in the passenger transport. Following a decrease in the total public transport in the first years after the new millennium, the statistics show a yearly growth as from 2004. As a result, the passenger kilometres increased by 10.1 per cent in the period 2004-2008.
| Passengers | Passangerkm | ||||||||||||||||||||||||||||||||||||||
|---|---|---|---|---|---|---|---|---|---|---|---|---|---|---|---|---|---|---|---|---|---|---|---|---|---|---|---|---|---|---|---|---|---|---|---|---|---|---|---|
| 1990 | 2000 | 2003 | 2004 | 2005 | 2006 | 2007 | 2008 | 1990 | 2000 | 2003 | 2004 | 2005 | 2006 | 2007 | 2008 | ||||||||||||||||||||||||
| Railway | 34 | 55 | 50 | 51 | 52 | 54 | 57 | 59 | 2 011 | 2 857 | 2 420 | 2 634 | 2 685 | 2 793 | 2 909 | 3 059 | |||||||||||||||||||||||
| Suburban railways and urban tramways | 81 | 103 | 97 | 91 | 97 | 102 | 104 | 114 | 419 | 496 | 476 | 458 | 518 | 508 | 535 | 572 | |||||||||||||||||||||||
| Scheduled road transport | 278 | 320 | 321 | 329 | 327 | 329 | 338 | 337 | 3 890 | 4 141 | 4 005 | 4 231 | 4 312 | 4 258 | 4 268 | 4 360 | |||||||||||||||||||||||
| Air transport | 7 | 10 | 9 | 9 | 10 | 10 | 10 | 10 | 2 665 | 4 415 | 3 799 | 4 043 | 4 142 | 4 294 | 4 408 | 4 521 | |||||||||||||||||||||||
| Public transport, total | 400 | 488 | 477 | 480 | 486 | 495 | 509 | 520 | 8 985 | 11 909 | 10 700 | 11 366 | 11 657 | 11 853 | 12 120 | 12 512 | |||||||||||||||||||||||
| Private cars | 3 094 | 3 504 | 3 697 | 3 785 | 3 825 | 3 948 | 4 064 | 4 145 | 42 696 | 49 055 | 52 127 | 52 606 | 52 400 | 53 302 | 54 866 | 55 956 | |||||||||||||||||||||||
Compared to 2007, the number of passengers on public transport increased by 2.2 per cent to 520 million passengers in 2008. The corresponding transport work constituted 12.5 billion passenger kilometres; an increase of 3.2 per cent from 2007.
Transport by air exceeded 4.5 billion passenger kilometres in 2008, thereby surpassing the previous record from 2000 of 4.5 billion passenger kilometres.
Sustained growth in traffic by private cars
The private car constituted almost 56.0 billion passenger kilometres in 2008; an increase of 2.0 per cent compared to 2007. Compared to public transport as a whole, this increase was about 1 percentage point lower. However, when the total public transport increased by 392 million passenger kilometres from 2007-2008, the corresponding increase for the private cars comes to 1 090 million.
Particularly strong increase in the road goods transport
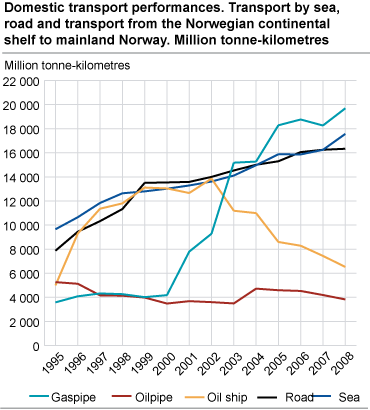
A total of 200 million tonnes were carried within Norway by Norwegian registered goods vehicles in 1975. A new barrier was passed in 2008, reaching 301 million tonnes. This was an increase of 8.3 per cent compared to 2007. The transport work done by the same vehicles constituted 17.6 billion tonne-kilometres in 2008, also an increase of little more than 8 per cent from the year before.
Almost 20 billion tonne-kilometres performed by gas transport by pipeline
A total of 19.7 tonne-kilometres or almost two thirds of the total transport work from the Norwegian continental shelf to Norwegian terminals was performed by gas transport by pipeline in 2008. In 2000 the equivalent share was one fifth. It is particularly the oil transport by tankers which has experienced a declining transport volume in recent years.
Tables:
Contact
-
Geir Martin Pilskog
E-mail: geir.martin.pilskog@ssb.no
tel.: (+47) 40 81 13 83

