Content
Published:
This is an archived release.
Passenger decline in rail transport
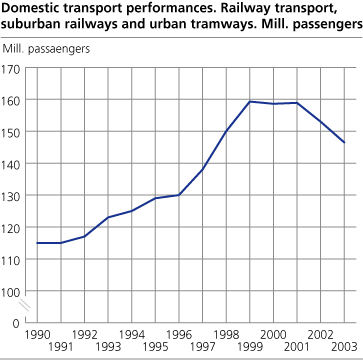
Increasingly fewer people travel by train and tramways, but the use of private cars remains stable. In 2003, 147 million travelled by public transport, a 4 per cent decline from 2002. Transport work decreased by 3 per cent to 2.9 billion passenger kilometres in 2003
Suburban railways and urban tramways experienced the strongest decline in passengers in 2003, with 5.6 per cent or 5 million passengers. The railway (excluding suburban railways) experienced a decline in passengers by 0.7 million in this period.
The 1990s represented a positive development in passenger transport by rail. In 1999, almost 160 million travelled by rail and the transport work comprised 3.4 billion passenger kilometres. Transport by rail stayed on this level until the decline started in 2002 and 2003
Use of private cars remains high
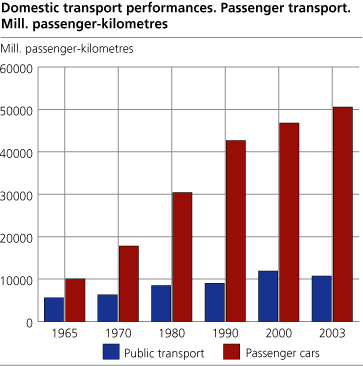
3.6 billion passenger journeys, or 81 per cent of all journeys, were by private cars in 2003. This is an increase of 2.5 per cent compared with the previous year and more than 7 per cent compared with 2000. The average length of journey is somewhat shorter for private cars than for other means of transport. This explains why private cars made up "only" 77 per cent of all means of transport and 51 billion passenger kilometres.
Domestic air travel has also experienced a decline in passengers since 2000. In fact, only scheduled road transport, with about 320 million passengers a year, has remained on a stable level in recent years. Still, the growth in total passenger transport has been steady since it levelled out at the end of the 1990s.
Oil and gas from the continental shelf
The total production comprised 58.2 billion tonne-kilometres in 2003, an increase of 1.9 billion tonne-kilometres or 3 per cent from 2002. The growth is attributable to increased transport from the continental shelf to the Norwegian mainland. The transport work increased from 26.7 billion tonne-kilometres in 2002 to 29.9 billion in 2003. The corresponding figure for the mainland was 28.4.
Gas in pipelines dominate
Measured in tonne-kilometres, pipeline transport remained stable for both oil and gas in the late 1990s. In 2001 and 2002, however, gas transport in pipelines increased sharply and came to 9.3 billion tonne-kilometres in 2002, representing almost 35 per cent of the total transport from the continental shelf to the Norwegian mainland. The figure increased by 5.9 billion tonne-kilometres in 2003 to 15.2. As a consequence, the share of the total transport from the continental shelf to the Norwegian mainland increased to 50 per cent. Traditionally, oil transport by ship has been the dominating means of transport from the continental shelf to the Norwegian mainland, but was surpassed by gas in pipelines in 2003.
Total mainland transport came to 308 million tonnes in 2003, a reduction of 9.4 per cent from 2002. Goods transport by road came to 73 per cent of the total main land tonnage, a decrease of 11.4 per cent from 2002 to 224.8 million tonnes in 2003. Measured in tonne-kilometres, the decrease was 2.7 per cent for this trade.
According to a new survey, the transport of goods by vans has been strongly overvalued in recent years, the main reason being that the number of such cars used as private cars is higher than previously estimated. The average length of journey per tonne is considerably shorter for vans than for lorries. This explains why tonnes carried is more influenced by these adjustments than transport work.
Tables:
Contact
-
Geir Martin Pilskog
E-mail: geir.martin.pilskog@ssb.no
tel.: (+47) 40 81 13 83


