Content
Published:
This is an archived release.
More transport of goods by road and rail
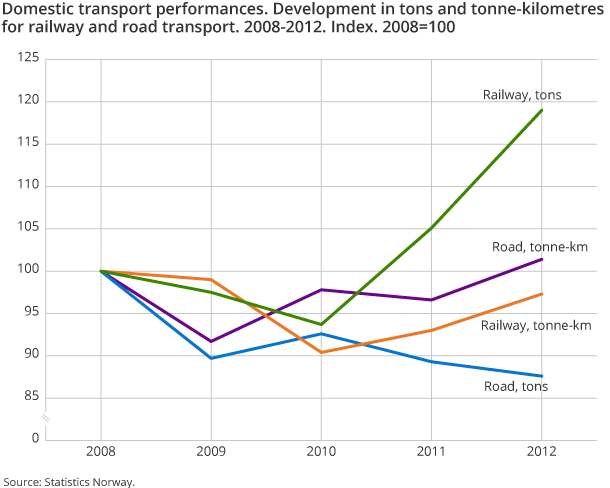
The transport work by lorry comprised 17.8 billion tonne-kilometres in 2012; an increase of 5 per cent from 2011. The corresponding growth for goods transport by rail was 4.6 per cent to 2.5 billion tonne-kilometres.
| 2011 | 2012 | Per cent | ||
|---|---|---|---|---|
| 2011 - 2012 | 2008 - 2012 | |||
| 1Including only passengers who enter as well as leave any means of transport in Norway. | ||||
| 2Including only goods which are loaded as well as unloaded in Norway. | ||||
| 3The data source for scheduled road transport (buses and coaches) has been changed as from 2010. This cause a brake in the time series (see “About the statistics” for supplementary comments). | ||||
| Passengers (million) | ||||
| Total | 5 159 | 5 235 | 1.5 | 4.6 |
| Water transport | 51 | 52 | 2.0 | 2.0 |
| Railway transport etc. | 195 | 199 | 2.1 | 15.0 |
| Road transport | 4 902 | 4 973 | 1.4 | 4.3 |
| Air transport | 11 | 11 | 0.0 | 10.0 |
| Million tons carried | ||||
| Total | 468 | 472 | 0.9 | -7.6 |
| Transport mainland, total | 361 | 358 | -0.8 | -9.6 |
| Water transport | 84 | 85 | 1.2 | -1.2 |
| Railway transport | 8 | 9 | 12.5 | 12.5 |
| Road transport | 269 | 264 | -1.9 | -12.3 |
| Air transport | 0 | 0 | ||
| Transport Norwegian continental shelf - mainland, total | 107 | 114 | 6.5 | -0.9 |
In spite of this considerable growth in the transport performances for both modes of transport in 2012, the 5-year period of 2008-2012 shows a less flattering development. While the tonne-kilometres by lorry increased by 1.4 per cent in this period, the tonne-kilometres by rail decreased by 2.7 per cent. This must be seen in connection with the tighter economic frames the transport industries experienced at the end of the previous decade.
Stability for maritime transport
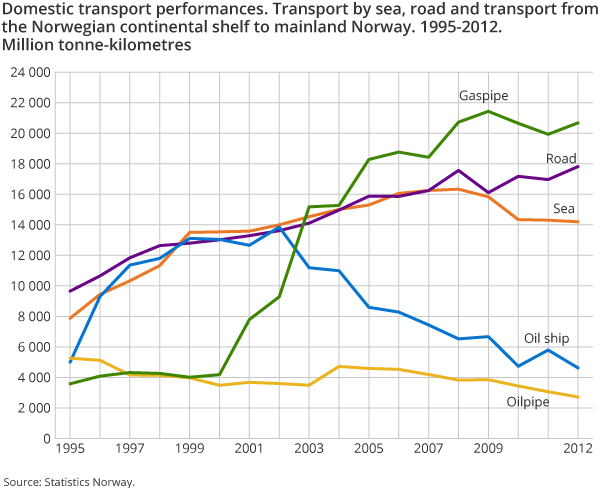
The transport performances at sea constituted 14.2 billion tonne-kilometres in 2012. Both 2009 and 2010 are characterised by a comprehensive decrease in production. As a result, the tonne-kilometres were reduced by 13 per cent in the period 2008-2012. In the last three years, however, the transport work at sea has been more or less unchanged.
Private car traffic flattens out
Domestic passenger transport performances in total came to 75.3 billion passenger kilometres in 2012. Private cars constituted 78 per cent of the total transport performances, corresponding to 58.7 billion passenger kilometres. Transport work performed by private cars increased by 1 per cent in 2012. The corresponding increase in the 5-year period 2008-2012 was 4.9 per cent. As a comparison, the traffic by private cars increased by 6.4 per cent and 7.2 per cent in the period 2004-2008 and 2000-2004 respectively – measured in passenger kilometres.
Less growth in the number of people using suburban railways and urban tramways
In recent years, the traffic by suburban railways and urban tramways has strongly increased. In 2008 and 2011, the increase in travel constituted 10 million and 12 million respectively. In 2012 there were almost 139 million journeys by this means of transport; an increase of 2.2 million passengers or 1.6 per cent compared to 2011. From 2008 to 2012, the number of passengers increased by 24 million; an increase of 21 per cent.
Contact
-
Geir Martin Pilskog
E-mail: geir.martin.pilskog@ssb.no
tel.: (+47) 40 81 13 83


