Content
Published:
This is an archived release.
Growth in restaurants
Operating income in restaurants increased by four per cent to NOK 37.9 billion from 2009 to 2010. Employment was 62 191 persons, almost unchanged from 2009.
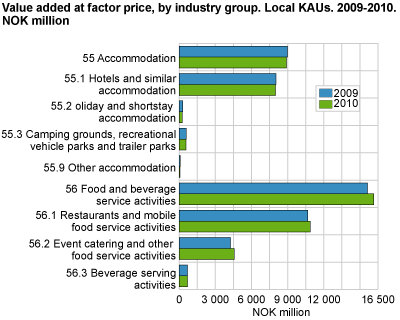
Restaurants and mobile food service activities is the largest group in the division with 67 per cent of value added and 74 per cent of employment.
Event catering and other food service activities employed 11 783 persons. Operating income was NOK 9.1 billion in 2010; 10 per cent up from 2009.
Low profit in hotels
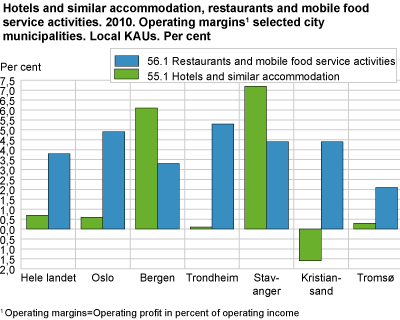
Gross operating margin was close to zero for the local kind-of-activity units in hotels and similar accommodation in 2010. This is by far the largest group and represented 90 per cent of value added and 89 per cent of employment in the accommodation division.
Regional differences
Stavanger holds the most profitable hotels, with an operating margin averaging seven per cent, while the hotels in Kristiansand made a loss in 2010. The national average was just one per cent.
The most profitable restaurants were in Trondheim, with an average operating margin of five per cent. The national average was four per cent.
Statistics at enterprise levelThe structural business statistics for transport are compiled both at local KAU level and at enterprise level. Figures at enterprise level will usually deviate from figures at local KAU level. This is due to the fact that the enterprise is registered in the industry sub-class that comprises the main part of the activity of the enterprise, and therefore may be registered in a different industry from some of the local KAUs. |
Operating result, gross operating surplus and operating marginOperating result is different from gross operating surplus. Operating result is operating income adjusted for operating costs, where both variables are defined in the General Trading Statement. Operating margin is operating result as a percentage of operating income. Gross operating surplus is value added adjusted for personnel costs. |
Tables:
- Table 1 Accommodation and food service activities. Main figures, by industry subclass. Local kind-of-activity units. 2009-2010
- Table 2 Hotels and restaurants. Main figures, by number of people employed and industry group. Local kind-of-activity units. 2010
- Table 3 Accommodation and food service activities. Main figures, by industry subclass. Enterprises. 2009-2010
- Table 4 Accommodation and food service activities. Main figures, by number of people employed and industry group. Enterprises. 2010
- Table 5 Accommodation. Main figures, by county. Local kind-of-activity units. 2010
- Table 6 Food and beverage service activities. Main figures, by county. Local kind-of-activity units. 2010
- Table 7 Accommodation and food service activities. Main figures, selected municipalities. Local kind-of-activity units. 2010
The statistics is now published as Business statistics.
Contact
-
Statistics Norway's Information Centre
E-mail: informasjon@ssb.no
tel.: (+47) 21 09 46 42


