Content
Published:
This is an archived release.
Full throttle for general cargo
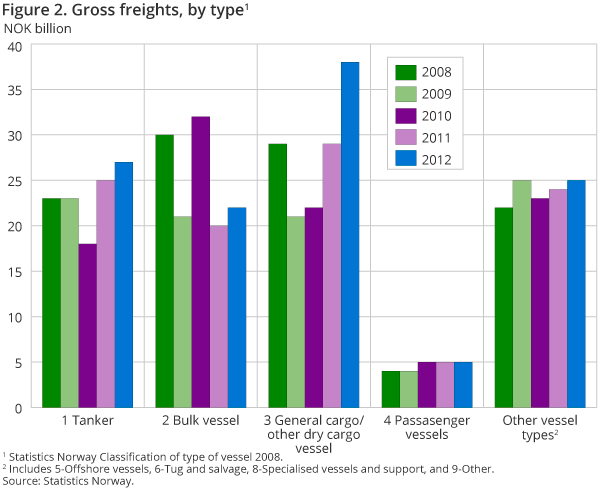
With almost NOK 38 billion worth of freight income, general cargo ships had a great year in 2012. The vessel type saw its freight income grow by more than NOK 8 billion from the year before.
| 2012 | Per cent change | ||
|---|---|---|---|
| 2011 - 2012 | 2008 - 2012 | ||
| Turnover | |||
| Freight goods | 74 806.3 | 28.6 | 14.7 |
| Pax freights | 4 136.9 | -6.6 | 4.7 |
| Timecharter | 34 597.6 | -2.9 | -2.0 |
| Bareboat freights | 4 125.9 | -17.8 | 3.2 |
| Commission including administrative pool earnings | 9 624.6 | 22.7 | 595.0 |
| Costs | |||
| Voyage dependent costs and bunker | 36 849.2 | 11.8 | 14.7 |
| Timecharter paid | 18 552.7 | 17.0 | -27.2 |
| Bareboat freights paid | 3 828.5 | -9.0 | 238.2 |
| Other costs | 56 839.3 | 23.1 | 132.8 |
| Operating profit | 11 221.6 | -5.5 | -48.3 |


Enterprises within ocean transport report their freight income by vessel type, and at NOK 37.6 billion, the general cargo vessel type makes up one third of all income in the industry in 2012. In other vessel types; tankers had a freight income of NOK 26.9 billion; offshore vessels an income of NOK 23.3 billion; bulk vessels an income of NOK 21.5 billion; and with passenger vessels, the income totalled NOK 5.5 billion. Except for a small reduction in freight income for the offshore vessels, all vessel types saw an increase in freight income in 2012.
Voyage freights with largest increase
Freight income from contracts based primarily on specified voyages totalled NOK 39.8 billion in 2012. This is almost 50 per cent more than the year before. For other contract types, a substantial increase was also observed for liner freights, which ended the year with NOK 19.1 billion.
Costs are keeping the lead
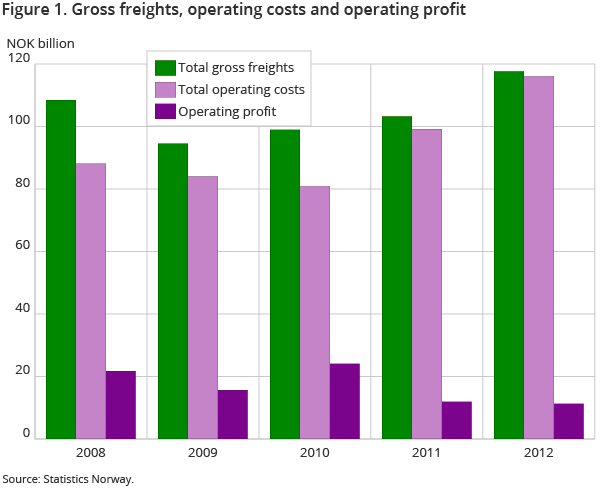
Increased production means increased costs, and from 2011 to 2012 costs went up more than income. Total costs increased by NOK 16.3 billion and ended at NOK 116.1 billion for 2012. Operating profit is still generous, but relative to operating income has fallen from 10.7 per cent in 2011 to 8.8 in 2012.
Coastal water transport steady
Enterprises engaged in coastal water traffic had a total operating income of NOK 10.9 billion in 2012; slightly less than 5 per cent more than in 2011. Domestic passenger transport and car ferry services still dominate with NOK 5.4 billion in 2012.
Contact
-
Tom Jonas Billit
E-mail: tom.billit@ssb.no
tel.: (+47) 40 81 13 45
-
Mikael Sandberg
E-mail: mikael.sandberg@ssb.no
tel.: (+47) 40 81 14 99
