Content
Published:
This is an archived release.
NOK 9.3 billion to transport and communication sector
Total gross working expenses in the counties' transport and communication sector came to NOK 6.2 billion kroner in 2002, an increase from 2002 of almost NOK 400 million. NOK 4.5 billion constituted expenses for the commercial modes of transport and the remaining part, almost NOK 1.7 billion, was spent on provincial roads. The municipalities' total gross working expenses were NOK 3.1 billion of which 2.9 billion were spent on the road sector.
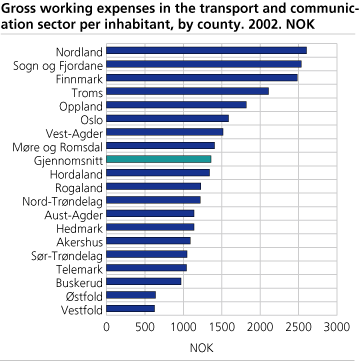
A gross working expense of NOK 1,350 per inhabitant was spent by the "average county" in the transport and communication sector in 2002. The span was from NOK 630 in both Vestfold and Østfold to NOK 2,600 in Nordland.
Low production
Almost NOK 4.2 billion of the total gross working expenses in the counties were used on purchasing services from the transport operators in 2002. NOK 2.6 billion were used in gaining services from the scheduled bus transport operators
On average - almost one travel per every fourth day
Exclusive transport by rail, 383 million passengers were transported by commercial modes of transport in 2002. Most of these travels were in Oslo and the fewest were in Finnmark, with 158 million and 3 million travels respectively. Also measured by the number of travels per inhabitants, Oslo was the dominating county with 306 travels per inhabitant in 2002. The average figure for the country as a whole constituted 84 travels, i.e. almost one travel every fourth day.
NOK 61, 000 per kilometre road
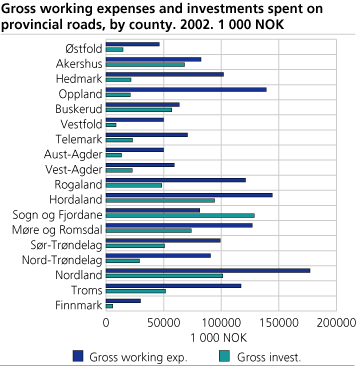
Nordland was the county with the highest gross working expenses with NOK 177 million to the provincial roads in 2002. NOK 69,000 made up the working expenses per kilometre provincial road in Nordland compared with the average figure for the country of NOK 61,000. Rogaland was on top with NOK 82,000 in gross working expenses per kilometre provincial road in 2002. The lowest figure per kilometre road was in Hedmark with 40,000 kroner used in 2002.
NOK 360 per inhabitant
Measured per inhabitant the counties' total gross working expenses to the provincial roads constituted on average NOK 360 in 2002. Troms was the county with the highest amount, NOK 769. The lowest expenses were in Akershus with NOK 171 per inhabitant.
Increased investments to provincial roads
NOK 830 million were the total gross investments in provincial roads in 2002. This was an increase from 2001 of 13 per cent.
Local roads
The total gross working expenses in all municipalities in the transport and communication sector constituted NOK 3.1 billion in 2002, an increase of about NOK 200 million from 2001. 94 per cent of these expenses were spent on the local roads. The total gross investments in the road sector came to NOK 1.4 billion in 2002, the same amount as in 2001.
The municipalities are responsible for the illumination along the national and provincial roads in addition to the illumination along the local road. NOK 485 million were spent on illuminating these roads, an increase in expenditures of four per cent from 2001.
Almost 11, 800 kilometres, or 31 per cent of the local roads, had a speed limit of 40 km/hour or less. The number of marked parking places in connection to main roads into a town constituted 19, 100 in 2002.
The figures presented in this article represent only a small contribution of the statistics in the area of transport and communication statistics. More details can be found on http://www.ssb.no/kostra .
Tables:
Find more figures
Find detailed figures for Transport and communication in municipalities and county authorities
Additional information
The figures in this article represent only a small part of the statistics in the area of transport and communication statistics. More details can be found at KOSTRA.
Contact
-
Christina Lyle
E-mail: christina.lyle@ssb.no
tel.: (+47) 46 48 34 44
-
Geir Martin Pilskog
E-mail: geir.martin.pilskog@ssb.no
tel.: (+47) 40 81 13 83
-
Jan Sebastian Rothe
E-mail: jan.rothe@ssb.no
tel.: (+47) 91 31 99 06


