Content
Published:
This is an archived release.
Lorry transport increased in 4th quarter
The transport by Norwegian lorries increased in the 4th quarter of 2011 compared with the corresponding quarter in 2010. Seven per cent more goods were carried on domestic transport than the same quarter last year, while the transport abroad transported nearly 3 per cent less.
In total, Norwegian lorries carried 71.7 million tonnes of goods domestically and 1.4 million tonnes abroad in the 4th quarter of 2011.
The transport performance for national and international transport as a whole increased from 5.35 billion tonne kilometres in the 4th quarter of 2010 to 5.36 billion in the 4th quarter of 2011. Transport performance when driving to and from Norway fell by 21.2 per cent to 785 million tonne kilometres.
Slight increase for the year as a whole
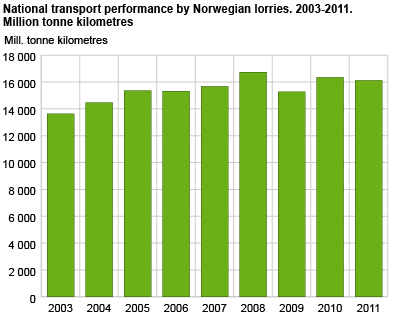
The increase in lorry transport in the 4th quarter was not strong enough to compensate the decline in the first quarter. From 2010 to 2011, the amount of domestic goods declined by 3.8 per cent, while transport performance fell by 1.3 per cent. The decline of transport abroad was slightly stronger.
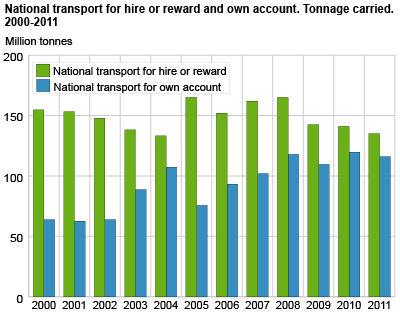
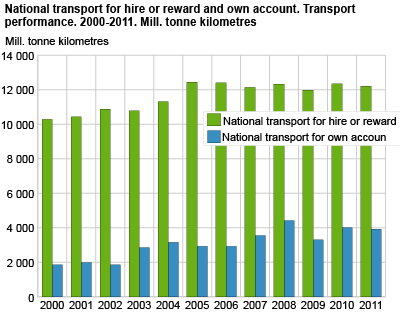
Transport for hire or reward is stable
Lorries driving for hire or reward made a domestic transport performance of 12.2 billion tonne kilometres in 2011, compared to 12.3 billion tonne kilometres last year. The transport for hire or reward had a share of total domestic transport performance of nearly 76 per cent; about the same as the previous year. The share has declined slightly in recent years, and in 2005 was 81 per cent.
64.3 kilometres per tonne
The average length of carriage of goods transported domestically was 64.3 kilometres per tonne. This is 1.7 kilometres longer than the year before. Although there can be random variation in how far the goods are transported from year to year, the long-term trend is clear. On average, goods are continuously being transported further. In the mid-90s, the average transport length was about 50 kilometres per tonne.
Same empty driving
More than a quarter of the distance covered in the national transport driving was on vehicles without a load. In 2011, the empty running percentage was 25.7, which is the same as the previous year. For lorries driven for hire or reward, the empty running share was 24.1 per cent. Since the composition of goods on foreign trips is usually different from driving in Norway, the empty running share is clearly lower on trips abroad; 19 per cent in 2011 compared with 17 per cent in 2010.
Greatest transport activity in Akershus
Most of all loading and unloading of goods took place in Akershus county. There were 31.4 million tonnes of goods loaded and 21.7 million tonnes of goods unloaded on lorries in 2011. Oslo, Østfold and Rogaland, all had between 20 and 30 million tonnes of goods loaded and between 14 and 20 million tonnes of goods unloaded. The lowest activity was in Troms, where 5.1 million tonnes of goods were loaded and 4.6 million tonnes of goods were unloaded in 2011.
Tables:
- Table 1. National and international transports for hire or reward and own account. Transport performances. Quarter
- Table 2 National transports for hire or reward and own account. Tonnage carried and transport performance, by commodity. Quarter. Mill. tonnes
- Table 3 International transports for hire or reward. Tonnage carried and transport performance, by commodity. Quarter
- Table 4 International transports for hire or reward and own account, to and from Norway. Tonnage carried and transport performance. Quarter
- Table 5 Comparisons with other Nordic countries. Tonnage carried. Million tonnes
- Table 6 Comparisons with other Nordic countries. Transport performance. Million tonne-kilometres
The statistics is now published as Carriage of goods by lorry.
Contact
-
Statistics Norway's Information Centre
E-mail: informasjon@ssb.no
tel.: (+47) 21 09 46 42