Content
Published:
This is an archived release.
Bus and rail passenger growth
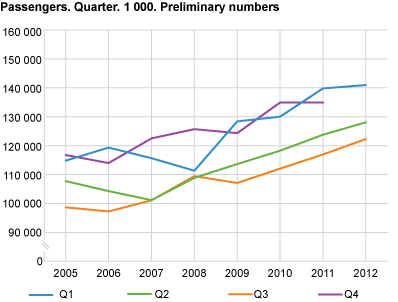
The number of passengers using public transport showed an increase of 4.6 per cent in the third quarter of 2012 compared to the same period in 2011. Bus and rail had almost equal growth, while boat decreased by 6.3 per cent.
Overall, there was an increase of 5.3 million passengers on public transport in the third quarter of 2012 compared to the same period in 2011. Bus passenger growth was 3.3 million and the corresponding figure for rail was 2.2 million, while passenger boats lost 175 000 passengers.
Production had an overall growth of 1.3 million kilometres, or 1.3 per cent, while ticket revenues increased by 3.1 per cent, to almost NOK 2.5 billion.
Most of the growth was in light rail and the underground
Nearly all rail passenger growth was in light rail and the underground. The number of train passengers was almost unaltered from the third quarter of 2011 to the third quarter of 2012.
Train kilometres increased by 5.4 per cent.
Increased ticket revenues, mainly for rail
The strong 4.9 per cent growth in bus passengers only gave an increase in ticket revenues of 1.8 per cent. At the same time, both passenger growth and ticket revenue growth were close to 5.0 per cent and almost identical. The number of boat passengers was reduced by 6.3 per cent from the third quarter of 2011 to the third quarter of 2012, but ticket revenues only dropped by 1.1 per cent.
| Vehicle-/boat-/train kms. 1 000 | Passengers. 1 000 | Ticket revenues. 1 000 NOK | |||||||||||||||||||||||||||||||||||||||||||||||||||||||||||||||||||||||||||||
|---|---|---|---|---|---|---|---|---|---|---|---|---|---|---|---|---|---|---|---|---|---|---|---|---|---|---|---|---|---|---|---|---|---|---|---|---|---|---|---|---|---|---|---|---|---|---|---|---|---|---|---|---|---|---|---|---|---|---|---|---|---|---|---|---|---|---|---|---|---|---|---|---|---|---|---|---|---|---|---|
| 2006 | 383 956 | 434 850 | 7 668 619 | ||||||||||||||||||||||||||||||||||||||||||||||||||||||||||||||||||||||||||||
| 2007 | 394 684 | 440 142 | 8 526 212 | ||||||||||||||||||||||||||||||||||||||||||||||||||||||||||||||||||||||||||||
| 2008 | 395 034 | 444 994 | 9 041 245 | ||||||||||||||||||||||||||||||||||||||||||||||||||||||||||||||||||||||||||||
| 2009 | 400 278 | 473 459 | 9 307 570 | ||||||||||||||||||||||||||||||||||||||||||||||||||||||||||||||||||||||||||||
| 2010 | 398 126 | 495 444 | 9 476 698 | ||||||||||||||||||||||||||||||||||||||||||||||||||||||||||||||||||||||||||||
| 2011 | 405 810 | 515 448 | 9 825 808 | ||||||||||||||||||||||||||||||||||||||||||||||||||||||||||||||||||||||||||||
| Q1 | 105 848 | 139 795 | 2 462 234 | ||||||||||||||||||||||||||||||||||||||||||||||||||||||||||||||||||||||||||||
| Q2 | 100 314 | 123 769 | 2 507 156 | ||||||||||||||||||||||||||||||||||||||||||||||||||||||||||||||||||||||||||||
| Q3 | 95 591 | 116 943 | 2 405 473 | ||||||||||||||||||||||||||||||||||||||||||||||||||||||||||||||||||||||||||||
| Q4 | 104 057 | 134 941 | 2 450 945 | ||||||||||||||||||||||||||||||||||||||||||||||||||||||||||||||||||||||||||||
| 2012 | |||||||||||||||||||||||||||||||||||||||||||||||||||||||||||||||||||||||||||||||
| Q1 | 107 728 | 140 955 | 2 497 268 | ||||||||||||||||||||||||||||||||||||||||||||||||||||||||||||||||||||||||||||
| Q2 | 102 004 | 128 070 | 2 523 377 | ||||||||||||||||||||||||||||||||||||||||||||||||||||||||||||||||||||||||||||
| Q3 | 96 856 | 122 282 | 2 481 074 | ||||||||||||||||||||||||||||||||||||||||||||||||||||||||||||||||||||||||||||
Preliminary figuresThe figures are preliminary and may be adjusted for comparisons to the new annual survey for 2012. |
Tables:
- Table 1 Vehicle kms, passengers and ticket revenues. Bus. 2006-2010, Q1-Q4 2011 and Q1-Q3 2012. 1 000. Preliminary figures
- Table 2 Boat kms, passengers and ticket revenues. Boat. 2006-2010, Q1-Q4 2011 and Q1-Q3 2012. 1 000. Preliminary figures
- Table 3 Train kms, passengers and ticket revenues. Rail. 2006-2010, Q1-Q4 2011 and Q1-Q3 2012. 1 000. Preliminary figures
Contact
-
Jardar Andersen
E-mail: jardar.andersen@ssb.no
tel.: (+47) 99 70 08 04

