Content
Published:
This is an archived release.
Increased public transport in the city areas
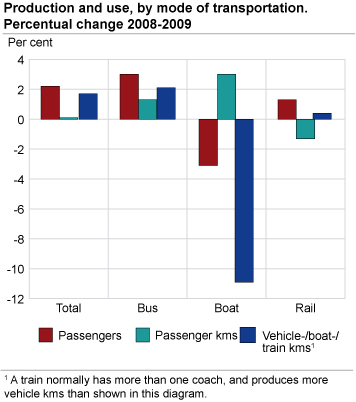
In 2009, for the first time ever, there were more than 300 million fares by buss in Norway. The total number of passengers travelling by bus, boat and rail increased by more than 10 million from 2008 to 2009. Most of the growth was by buss in the city areas, but suburban railways and urban tramways also continued the positive trend from the previous year.
The total number of public transport fares increased by 2.3 per cent from 2008, ending at 484 million. The number of fares by bus in city areas rose by 5.2 per cent, causing a total growth in bus fares of 3.0 per cent.
Public transport by train had a tiny decrease in number of fares. However, a steady growth for suburban railways and urban tramways caused the total number of fares in rail transportation to increase by 1.3 per cent.
More resource use and more production in the cities
13.7 per cent more subsidies in city areas resulted in increased route production, measured in both vehicle kilometres and seat kilometres. The extent of subsidies has almost been doubled the last 5 years.
Fewer, but longer fares by boat
Despite a 3.1 per cent decrease in fares, the total number of passenger kilometres by boat rose by 3.0 per cent. This caused an increase in average length of fares, which probably is one reasons that the ticket revenues for boat transport rose by 6.0 per cent.
Unsteady comparability over timeBoth the boat and the bus sector have faced major changes in structure, technology and types of contracts. These changes make it difficult to compare figures over time. |
Tables:
Contact
-
Jardar Andersen
E-mail: jardar.andersen@ssb.no
tel.: (+47) 99 70 08 04

