Content
Published:
This is an archived release.
Increase in use of public transport
Compared with 2005, there was an increase of more than 11 million passengers by bus, boat and rail in 2006, though the production was unchanged.
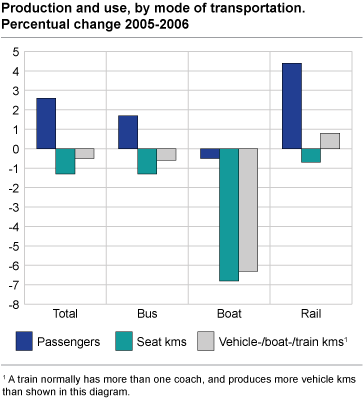
An increase of 2.6 per cent added public transportation up to a total of 453 million fares in 2006. The increase was strongest in the rail sector (4.4 per cent) and more modest for bus transportation (1.7 per cent). Transportation by boat decreased by 0.5 per cent.
Seat kilometres decreased by 320 million (1.3 per cent), and half of it was in the bus sector. Vehicle kilometres had a more modest decrease (0.5 per cent), and train kilometres even rose by 0.8 per cent. Boat kilometres decreased by 6.3 per cent.
Buses increase in urban areas
All extra fares by bus, was in major city areas, though an increase of production. Utilisation of capacity was clearly highest for inter-county routes (391 per cent).
More local transport on rails
Only 1 of 6 extra fares by rail came from NSB, and all of this was by local routes. Total amount of fares by rail (NSB exluded) was 106 million.
Boats in trouble
Though reduced activity and almost identical number of passengers, boat costs increased more than income.
Tables:
Contact
-
Jardar Andersen
E-mail: jardar.andersen@ssb.no
tel.: (+47) 99 70 08 04