Content
Published:
This is an archived release.
A hundred fares a year
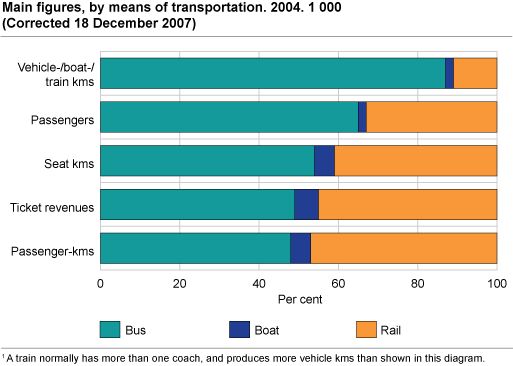
On average, Norwegians used public transport almost a hundred times in 2004. We travelled a total distance by bus, boat and rail that is equivalent to going around the world 150,000 times. Bus was the preferred mode of transport in two out of three journeys.
Public transport accounted for 6,400 million passenger kilometres in 2004. We travelled almost the same distance by train and bus; about 3,000 kilometres by each mode of transport. Norwegian buses had 279 million passengers in 2004; nearly twice as many as the rail sector. Boat as a mode of transport is marginal, but is undoubtedly important locally.
Buses are local
In terms of distance covered, bus is the dominant mode of transport with nearly 90 per cent of the total route production. Nine out of ten bus passengers travel intra-county, but inter-county routes account for a quarter of all passenger kilometres. Two out of three fares are in cities or densely populated areas and more than 50 per cent are in specially-defined city areas. Utilisation of capacity is best for inter-county routes (32 per cent) and poorest for intra-county routes in non-densely populated areas (21 per cent).
Most kilometres by NSB
NSB had 46 million passengers in 2004, of which 80 per cent travelled by local train. Nevertheless, regional trains produce almost 60 per cent of a total 2,390 million passenger kilometres. Utilisation of capacity is also clearly best for regional city-to-city trains (approximately 50 per cent).
In terms of passenger numbers, other rail transport is more than twice as popular as NSB. However, in passenger kilometres, the opposite is true. An average journey with NSB is more than 50 kilometres, while other rail trips barely exceed seven kilometres. Utilisation of capacity for rail transport excluding NSB has low variation and is the same level as for inter-county buses.
Large operating profit for bus
Public bus transport generated a total income of NOK 6.7 billion in 2004, which led to an operating profit of almost NOK 1 billion. Total profit was NOK 100 million. Public subsidies covered nearly half of the total income base, but for inter-county routes only one out of five NOK are subsidies. For intra-county routes outside cities, the subsidy percentage is more than 70.
A total of 8.9 million journeys by boat cost more than NOK 1 billion. Operating profit was NOK 146 million, but overall there was a deficit of NOK 54 million. The average cost per passenger kilometre was NOK 4.25; more than twice the cost for bus.
Lower ticket price on bus
Even though the number of express bus services is continually growing, the average bus journey is only half the distance of journeys by boat or train. Shorter distances are also reflected in ticket revenues. The mean ticket price by boat is four times higher than by bus.
Tables:
Contact
-
Jardar Andersen
E-mail: jardar.andersen@ssb.no
tel.: (+47) 99 70 08 04

