Content
Published:
This is an archived release.
Public transport reaching new heights
More than 500 million trips were made by public transport in 2010. This is an increase of 21 million passengers from the previous year. Most of the growth was in urban areas, where the positive trend for taking the bus, tram and underground continues.
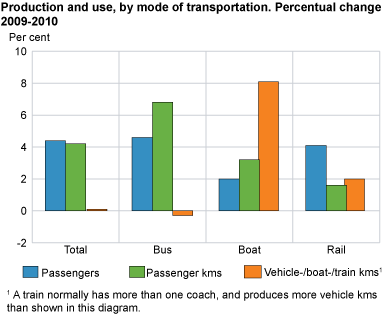
The total passenger figures for public transport have shown an increase of 4.4 per cent since 2009, and amounted to 505 million in 2010. Two out of three new passengers took the bus, and the majority of these were in urban areas. The increase in traffic for trams and the underground was just below 6 per cent. Boats had a more moderate increase in passengers, of 2.0 per cent, and the railway showed only a marginal positive change.
Cities lead the way
Most of the increase in passengers has been in urban areas, with the three largest cities leading the way. This has happened without any major increase in public purchases, and is also accompanied by cost reductions with the transporters.
An urban railway was commissioned in Bergen in June, which has made a considerable contribution to the total transport performance. It is worth noting that the bus traffic in Norway’s second largest city, nevertheless, remains more or less the same.
More effective service operation
The increase in passenger numbers has taken place despite the fact that the distance driven in the bus industry fell from 2009 to 2010. However, this reduction was in journeys where the bus was not in service (positioning runs), so the number of kilometres driven while in service has actually increased. Furthermore, the distance driven in urban areas increased by 3.1 per cent, while journeys beyond county borders have seen a clear reduction.
The same improvement in efficiency is even more apparent for boats. Trips without passengers fell substantially, despite an increase in distance travelled of 8.1 per cent.
Longer bus journeys outside urban areas
The transport performance for buses increased even more than the number of passengers compared with 2009. This is partly due to the fact that trips within counties, outside urban areas, have become an average of 3 kilometres longer, while journeys beyond county borders and journeys within towns and cities have become shorter than the previous year.
Definitions of termsSeat kilometre: Total number of kilometres that available seats have travelled. Passenger kilometre: Total number of kilometres that the passengers have travelled. Transport performance: A generic term which, regardless of the context, denotes passenger kilometres or tonne kilometres. Distance driven: The total number of kilometres that the transport units have driven. A generic term which, regardless of the context, denotes vehicle kilometre, boat kilometre or train kilometre. Positioning runs: Driving while not in service, i.e. between the garage/night parking place and the start/end of the route. |
Public transportPublic transport in this context covers all transport following a route by bus, rail, tram or boat. Aeroplanes, taxies, car ferries and Hurtigruta are not included. |
Uncertain time seriesBoth the bus and boat sector have been subjected to major structural, contractual and technological changes in recent years. The postponement of tenders, gross contracts and electronic ticketing have all contributed to greater uncertainty in the changes in the supply and demand for public transport. In Oslo/Akershus, changes were made to the calculation model for the number of bus passengers in 2010. |
Tables:
Contact
-
Jardar Andersen
E-mail: jardar.andersen@ssb.no
tel.: (+47) 99 70 08 04

