Content
Published:
Fewer combined goods vehicles
At the end of 2002 there was a total of 220 113 vehicles registered for goods transport in Norway, a decrease of one per cent from the previous year. The decrease is mainly due to the five per cent fall in the number of combined vehicles in this period.
The number of vans with a carrying capacity of one tonne or more increased by 4.5 per cent from 2001 to 2002, and at the end of 2002 there were 50 640 vans registered in Norway. A total of 80 per cent of these were diesel powered. In 1990 the corresponding share was 35 per cent.
Increase in carrying capacity
Last year the goods vehicles had a total carrying capacity of 729 119 tonnes, approximately the same as the previous year. Since 1990 the total carrying capacity has increased by 8.1 per cent. The lorries' share of the total carrying capacity for goods vehicles has decreased from 60.9 per cent in 1990 to 49.4 per cent in 2002.
More light lorries
The average annual rate of growth for lorries with a carrying capacity of less than two tonnes was 11.1 per cent from 1993 to 2002, and these lorries constituted 18 218 vehicles at the end of last year. This was 8.3 per cent of the total stock, but only 3.3 per cent of Norwegian goods vehicles' total carrying capacity.
and heavy ones
The number of heavy lorries - with a carrying capacity of 15 tonnes or more - has increased by 200 per cent since 1990. The number of tractors for semi-trailers increased with 40.7 per cent in the same period.
Fewer petrol powered goods vehicles
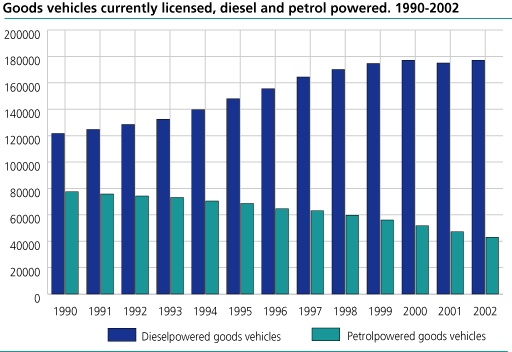
At the end of 2002 there were 177 106 goods vehicles registered in Norway. This was 80.5 per cent of the total stock of goods vehicles. The number of petrol powered vehicles decreased by 8.9 per cent from 2001 to 2002, while the number of diesel powered goods vehicles increased by 1.2 per cent in the same period. During the last ten years the average annual rate of growth for petrol powered goods vehicles has been -5.7 per cent, while the corresponding rate for diesel powered goods vehicles was 3.3 per cent.
Growth in Akershus only
At the end of last year Akershus had more goods vehicles registered than any other county in Norway with a stock consisting of 27 552 vehicles. Akershus was the only county with growth in the number of goods vehicles since 1999. During these four years the average annual rate of growth in the number of goods vehicles was 4.1 per cent, while for the rest of the country the corresponding rate was -2.3 per cent.
Next to Akershus, Hordaland was the county with most registered goods vehicles last year, with 21 682 vehicles. The three counties Akershus, Hordaland and Oslo had 32 per cent of the total stock of goods vehicles in Norway.
Oslo had most vans registered at the end of 2002, with a total of 6 578 vehicles. Akershus followed closely with ten vehicles less than Oslo.
Finnmark had fewest goods vehicles with 4 335 vehicles registered at the end of last year. Vest-Agder had the highest average annual decline in the stock from 1999 with five per cent.
Tables:
- Table 1 Registered road goods vehicles, by type of vehicle. 31 December
- Table 2 Carrying capacity of registered road goods vehicles, by type of vehicle. 31 December. Tonnes
- Table 3 Registered road goods vehicles, by type of vehicle and county. 31 December 2002
- Table 4 Carrying capacity of registered road goods vehicles, by type of vehicle and county. 31 December 2002. Tonnes
The statistics is published with Registered vehicles.


