High cargo volumes from Oslo and Akershus
Published:
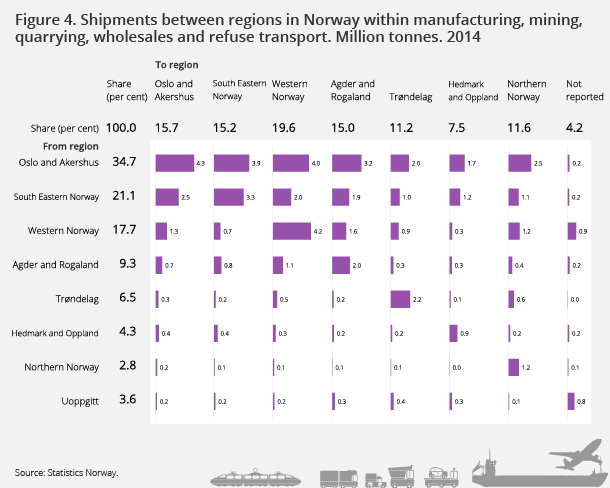
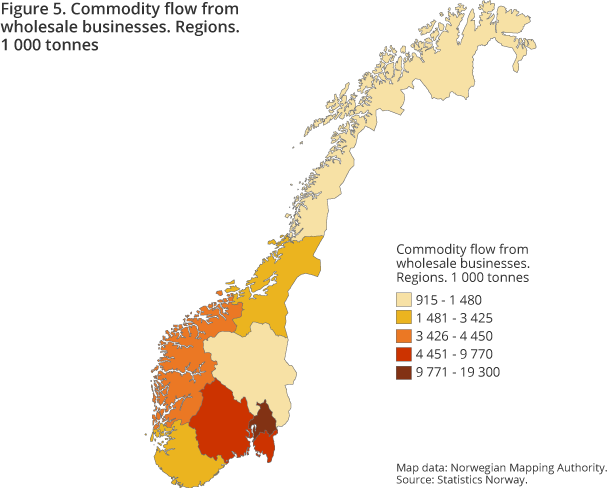
In 2014, about one third of all shipments from establishments within mining and quarrying, manufacturing, sewage and collection of waste and wholesale trade were sent from Oslo and Akershus to recipients around the country. This corresponds to 21.8 million tonnes.
- Full set of figures
- Commodity Flow Survey (discontinued)
- Series archive
- Commodity Flow Survey (archive)
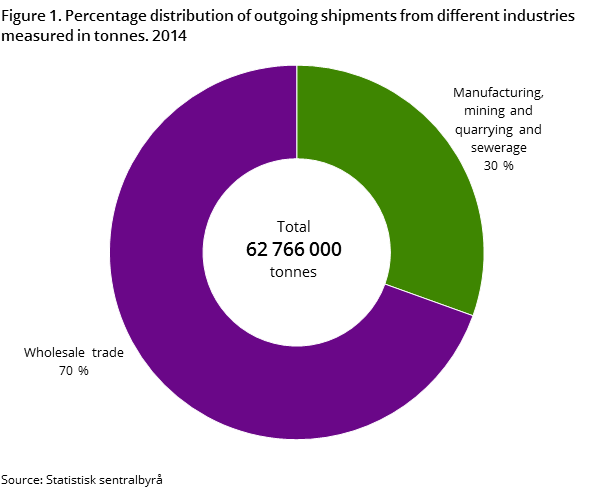
In total, 62.8 million tonnes of outbound deliveries were transported from establishments within these industries in 2014. This is reflected in the results from the commodity flow survey conducted in 2014, where the distribution pattern within and between different regions in selected industries is examined. Light is also shed on imports and exports of goods using data from the external trade statistics.
Wholesale dominates
A total of 43.6 million tonnes of goods were transported from establishments within wholesale trade in 2014, of which 19.1 million tonnes were transported from Oslo and Akershus. The largest recipients outside the sender area were the three northernmost counties in Western Norway, which received 3.5 million tonnes. These three counties received the most goods from wholesale trade establishments around the country, with a total of 8.3 million tonnes. Oslo and Akershus and the rest of Eastern Norway received 7.3 and 7.1 million tonnes respectively.
One third of wholesale trade is in household goods
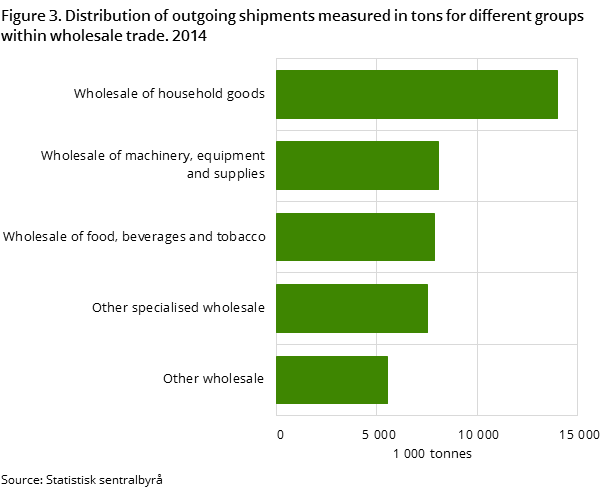
Within the wholesale trade, the industry that generates most of the transport is 'Wholesale trade, except motor vehicles and motor cycles'. Within this industry group, transport from 'Wholesale of household goods for personal consumption' represents 14.0 of a total of 43.0 million tonnes. Next is 'Wholesale of other machinery, equipment and supplies' and 'Wholesale of food, beverages and tobacco', with 8.1 and 7.9 million tonnes respectively.
Significant deliveries from manufacturing industries in Western Norway
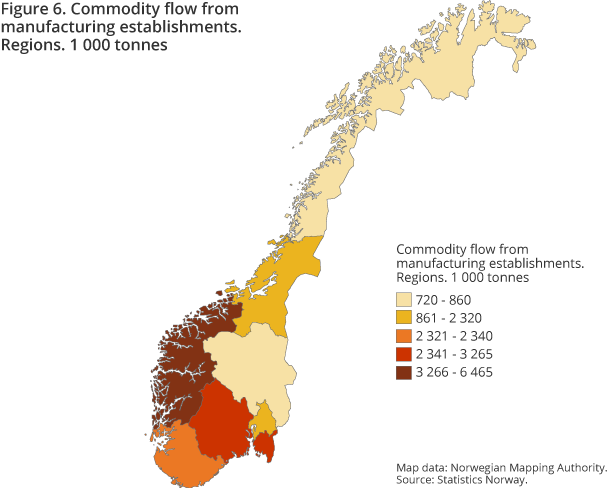
A total of 17.7 million tonnes were transported from manufacturing establishments. From the three northernmost counties in Western Norway, 6.5 million tonnes were transported, of which 1.0 million tonnes went southward to Agder and Rogaland, while 1.9 million tonnes were transported internally in the three counties.
The same three western counties received 3.8 million tonnes of the transport from the country's manufacturing establishments. Agder and Rogaland received 2.8 million tonnes, while Oslo and Akershus was the destination for a total of 2.7 million tonnes, mainly from Western Norway with 700 000 tonnes and South Eastern Norway with 800 000 tonnes. Manufacturing industries sent 2.1 million tonnes to Northern Norway. Western Norway made up the majority of these shipments, with 900 000 tonnes.
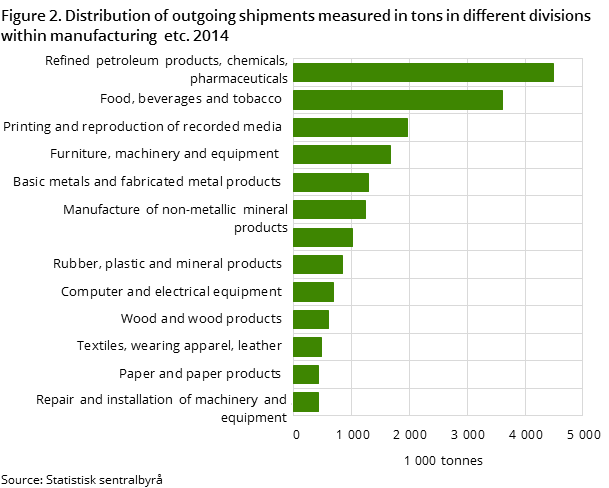
The 'Oil refining and chemical pharmaceutical industry' transports the most, with 4.5 million tonnes. Next is the 'Food, beverages and tobacco industry', which produces 3.6 million tonnes. 'Printing industry' and 'Furniture and computer industries' represented 2.0 and 1.7 million tonnes of goods respectively.
Recycling and waste generate a lot of transport
A total of 683 000 tonnes were transported from establishments within the collection and recycling of waste domestically in 2014. Much of this is transported within the regions, but a total of 111 000 tonnes were transported from Oslo and Akershus to Northern Norway, out of a total of 167 000 tonnes. The situation is also similar in the Trøndelag counties, where 53 000 of 57 000 tonnes were transported to Northern Norway.
Exports and imports
In 2014, 78 million and 41 million tonnes of goods were exported and imported respectively. A total of 89 per cent of total exports were transported by ship/ferry out of the country, and 67 million tonnes were imported. After cargo at sea, lorry is the most commonly used mode of transport. A large part of the exports and imports is transported by lorry within Scandinavia and to and from the Baltic region. Sixty-eight per cent of all goods imported from Sweden are transported by lorry. The corresponding figure for Finland is 52 per cent. A large part of the imports from the Baltic countries and Poland is transported by lorry. In total, 29 per cent of imported goods were transported by lorry. Around 2 per cent of imported goods were transported by rail.
Contact
-
Asbjørn Willy Wethal
-
Statistics Norway's Information Centre

