Content
Published:
Major growth in computer activities in 2007
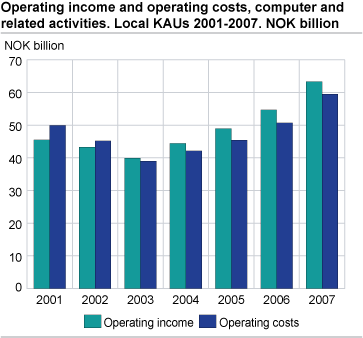
The major growth in computers and related activities continued in 2007. The businesses had a total turnover of NOK 63 billion. The operating result was NOK 3.8 billion.
Computers and related activities had an increase in employment from 2006-2007 of 9 per cent. A total of 41 452 persons added value of NOK 32.5 billion. Operating income increased slightly less than operating costs, giving an operating result of NOK 200 million less than 2006. NOK 3.8 billion is still the second highest result since 2002. The operating margin was 6 per cent.
Value added per employee highest in data processing
Computers and related activities consist of hardware consultancy, software consultancy and supply, data processing, database activities, maintenance and repair of office, accounting and computing machinery and other computer and related activities. Value added per employee was the highest within data processing, NOK 945 000. The operating margin was 4.6 per cent and the operating result was NOK 596 million.
Software consultancy and supply continues to grow
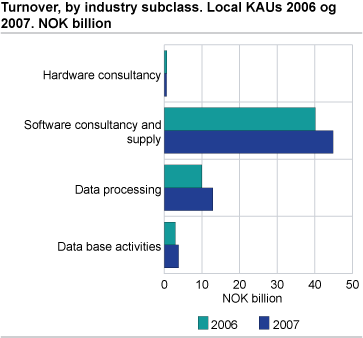
Software consultancy and supply is by far the largest industry class within computer and related activities, and continued to grow in 2007. Turnover was up 11.6 per cent from 2006, ending at NOK 44.8 billion. The operating result was NOK 2.84 billion, NOK 124 million less than the record-breaking year 2006. Operating costs and operating income increased by 12.9 per cent and 11.7 per cent respectively. On average, the 31 246 employees each added value of NOK 765 000.
Large businesses had higher value added per employee
The larger the business, the higher the value added per employee. Businesses in the employment group 0-1 had an average value added per employee of NOK 511 000. The corresponding figures for the employment groups 10-19 and 250 or more were NOK 803 000 and 963 000. Size also has a bearing on personnel costs per employee, which were NOK 210 000 for businesses in the employment group 0-1. Personnel costs for businesses in the 10-19 group were three times higher (NOK 621 000), and in the 250 or more group were NOK 774 000.
Enterprise figures
The structural business statistics for computer and related activities are compiled both on the local KAU level and on the enterprise level. Turnover on the enterprise level increased by 14.3 per cent from 2006-2007 to NOK 62.8 billion. The enterprises employed 41 238 persons in 2007. This corresponds to the figures for local KAUs.
Statistics on the enterprise levelThe structural business statistics for computer and related activities are compiled both on the local KAU level and on the enterprise level. Figures on the enterprise level will usually deviate from figures on the local KAU level. This is due to the fact that the enterprises are registered in the industry subclass that comprises the main part of the activity of the enterprise, and therefore may be registered in a different industry than some of the local KAUs.
Revision of industriesIn 2007 and 2008, the enterprises in Statistics Norway’s Central Register of Establishments and Enterprises were coded in accordance with the new Standard Industrial Classification (SN2007). This has revealed some incorrectly classified enterprises and local KAUs. In such cases, the code according to the current standard (SN2002) has been revised. The new Standard Industrial Classification (SN2007) will be used for the first time in the publishing of preliminary figures for the statistical year of 2008, in October 2009. Descriptions of the classifications are available here . |
Tables:
- Table 1 Computer and related activities. Principal figures, by industry subclass. Local kind-of-activity units. 2004-2007
- Table 2 Computer and related activities. Principal figures, by number of persons employed and industry group. Local kind-of-activity units. 2007
- Table 3 Computer and related activities(NACE 72). Principal figures, by county. Local kind-of-activity units. 2006 and 2007
- Table 4 Computer and related activities. Principal figures, by industry subclass. Enterprises. 2004-2007
- Table 5 Computer and related activities. Principal figures, by number of persons employed and industry group. Enterprises. 2007
The statistics is now published as Business statistics.
Contact
-
Statistics Norway's Information Centre
E-mail: informasjon@ssb.no
tel.: (+47) 21 09 46 42


