Content
Published:
This is an archived release.
Computer equipment and software for NOK 1.67 billion
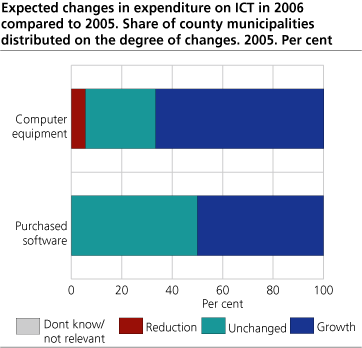
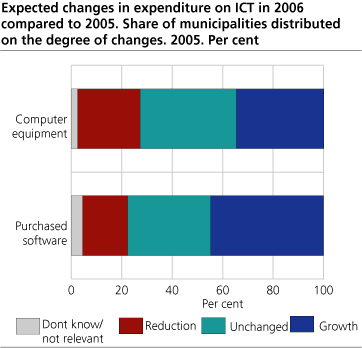
Municipalities and county municipalities spent NOK 1.67 billion on computer equipment, software and consultancy services in 2005. A majority of the municipalities and county municipalities expect their expenses on computer equipment and software to increase or remain unchanged in 2006.
County municipalities spend NOK 342 million on computer equipment, software and related consultancy services. Among these NOK 254.6 million was spend on computer equipment and NOK 87.6 was spend on software and related consultancy services. In total municipalities spend NOK 1 324 million on computer equipment, software and related consultancy services.
About half of the municipalities and county municipalities expect to spend more on software during 2006 than in 2005. Correspondingly 35 per cent of the municipalities and 67 per cent of the county municipalities expect that expenditure on computer equipment shall increase in 2006.
Electronic services
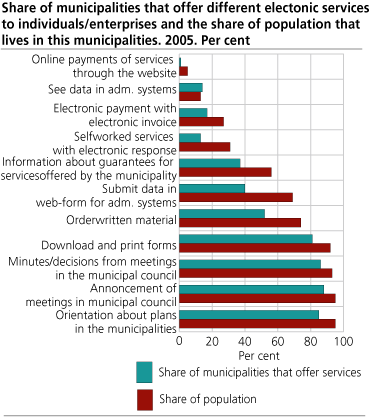
More than 90 per cent of the population lives in a municipality that announce meetings in the local council, publish minutes from these meetings and orientate about local plans through the web. Access to more advanced services are less widespread. 69 per cent of the population lives in a municipality where it is possible to report data electronically through a webform, e.g application to kindergarten.
The number of municipalities that offer services are lower than the part of the population that have access to the same services. This is because it is more common among more populous municipalities to offer services through the web.
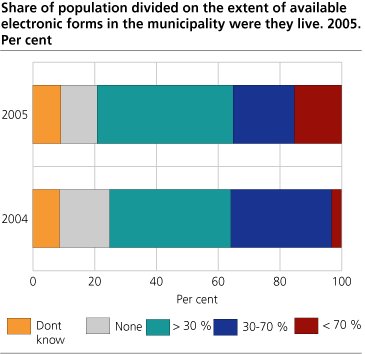
In 2005 15 per cent of the population resided in a municipality were more than 70 per cent of all public forms were available for electronic supplementing and reporting. In 2004 3 per cent of the population did have the same access. Some municipalities have not prepared any of their forms for electronic supplementing and reporting. In 2005 12 per cent of the population resided in these municipalities, compared to 16 per cent in 2004.
|
The survey about use of ICT in Norwegian municipalities and county municipalities are part of KOSTRA (Municipality-State-Reporting). By June 2005, 94 per cent of the municipalities and all the county municipalities responded to the survey. Oslo is included in the figures at municipality level. Some of the data in the survey are used in the publication "Nøkkeltall om informasjonssamfunnet 2004". Some of the variables are also published at municipality and county level in KOSTRA: http://www.ssb.no/emner/10/03/sa_ikt/sa80/kap6.pdf http://www.ssb.no/emner/10/03/sa_ikt/sa80/kap7.pdf http://www.ssb.no/emner/10/03/sa_ikt/sa80/kap10.pdf http://www.ssb.no/kostra/stt/faktaark.cgi Statistics Denmark has carried out a similar survey, which makes it possible to compare the results in some areas. Results from the Danish survey are available at: |
Tables:
- Table 1 Expenditure on computer equipment, software and related consultancy services in municipalities and county municipalities. 2005. NOK 1 000
- Table 2 Expected changes in expenditure on ICT in 2006 compared to 2005. Share of municipalities and county municipalities distributed on the degree of changes. 2005. Per cent
- Table 3 Share of population with access to different types of services offered by municipalities on Internett. 2005. Per cent
- Table 4 Share of population divided on the extent of available electronic forms in the municipality of residence. 2005. Per cent
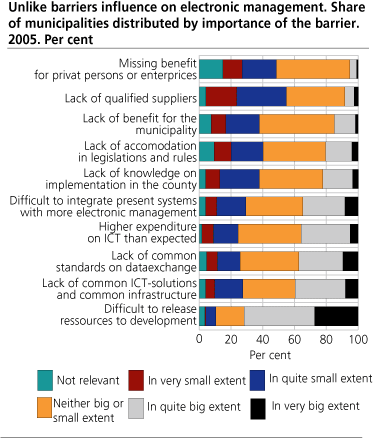
- Table 5 Different barriers influence on electronic administration in municipalities. Share of municipalities distributed by the importance of a barrier. 2005. Per cent
- Table 6 Different barriers influence on electronic administration in the county municipalities. Share of county municipalities distributed by the importance of a barrier. 2005. Per cent
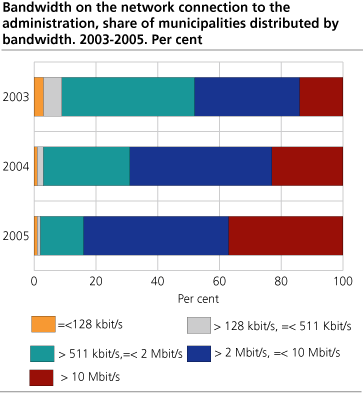
- Table 7 Bandwidth out on the network connection to the administration, share of municipalities distributed by bandwidth, county and number of inhabitants. Per cent. 2004-2005
- Table 8 Share of municipalities and county municipalities with a ICT-strategy that are updated within the two last years. 2004 and 2005. Per cent
- Table 9 Share of counties and municipalities with different areas included in a updated ICT-strategy. 2005. Per cent
The statistics is now published as Digitalisation and ICT in the public sector.
Contact
-
Statistics Norway's Information Centre
E-mail: informasjon@ssb.no
tel.: (+47) 21 09 46 42

