Content
Published:
This is an archived release.
More custody and fewer prison days
In 2013, the total number of days in prison facilities was higher than in 2012 due to an increase in the use of custody. Fewer served sentences in prison, while more were subjected to electronic monitoring at home.
| All types of imprisonment | Custody | Prison sentence, institution | Prison sentence, electronic monitoring | Preventive detention | Serving sentence for non-payment of a fine | |
|---|---|---|---|---|---|---|
| 1Prison sentence by electronic monitoring not included. | ||||||
| Prison population per 1 January | 3 869 | 961 | 2 696 | 99 | 80 | 33 |
| New imprisonments | 11 834 | 3 986 | 5 459 | 1 671 | 1 | 717 |
| Discharges | 11 327 | 2 146 | 6 624 | 1 727 | 8 | 822 |
| Days of imprisonment | 1 362 618 | 375 823 | 931 039 | .. | 30 868 | 24 888 |
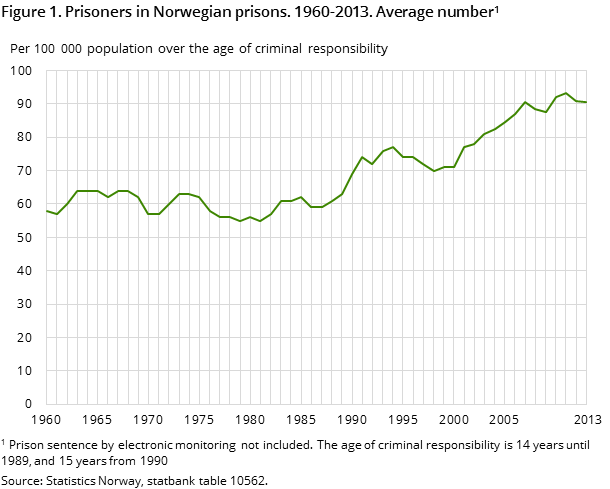
Of the 3 869 prisoners at the beginning of 2013, 72 per cent were serving a prison sentence and 25 per cent were being held in custody. An additional 2 per cent were under preventive detention, while 1 per cent was serving a sentence for non-payment of a fine.
Type of imprisonment depends on age and type of offence
The use of different types of imprisonment varies depending on the prisoner’s age and which type of offence constitutes the principal offence for imprisonment.
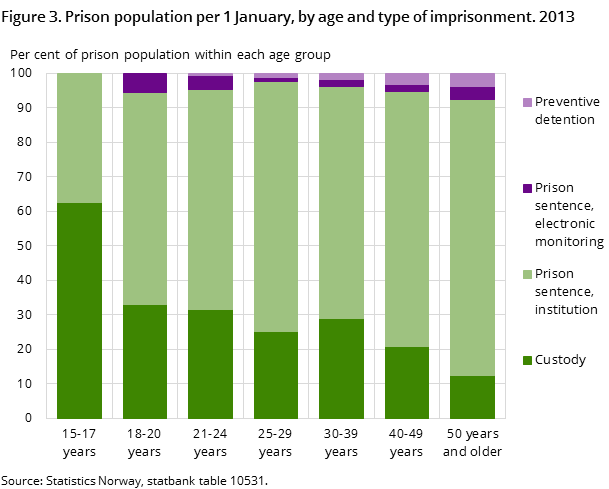
During 2013, only 27 new imprisonments of persons aged 15-17 were registered – all of whom were held in custody. For older age groups, however, a far greater share served a prison sentence (see figure 3).
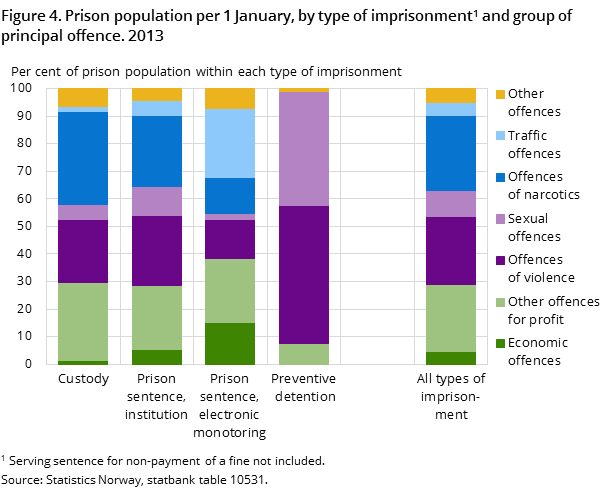
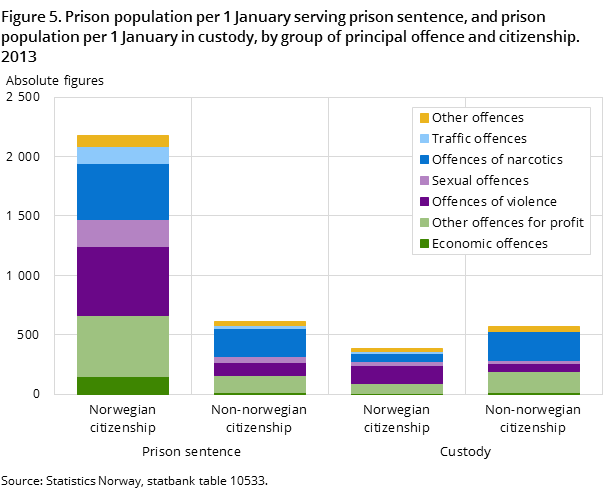
Of the 961 persons held in custody at the beginning of 2013, 34 and 28 per cent were being held for narcotic offences and other offences for profit respectively as their principal offence. Furthermore, 23 per cent were being held mainly for offences of violence as their principal offence, while 5 per cent were being held for sexual offences. In comparison, of the 80 persons being held in preventive detention at the start of 2013, offences of violence and sexual offences were the principal offence for 50 and 41 per cent respectively (see figure 4).
Most prison sentences for violence, theft, traffic and narcotics
Offences of violence and offences for profit are the groups of principal offence that led to the most prison sentences in 2013 – 4 848 of the total of 11 834 new imprisonments. Prison sentences for traffic and narcotic offences were about level in 2013, with a total of 4 170 new imprisonments.
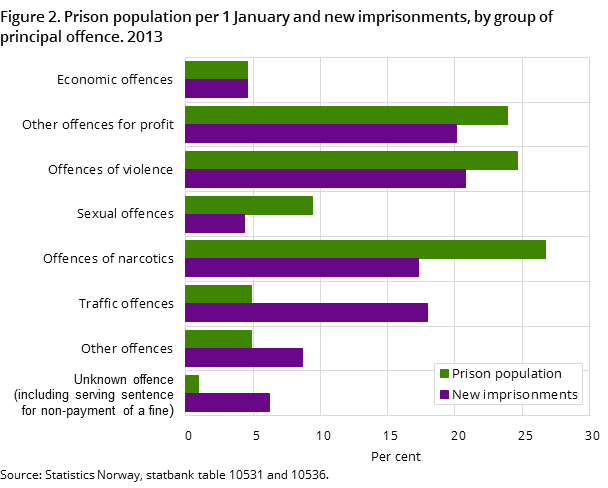
Offences for which persons are imprisoned during a year are different from the offences for which persons are serving prison sentences at any given time. This is partly due to the relatively big share of shorter sentences and misdemeanours amongst the new imprisonments. For example, traffic and narcotic offences made up 18 and 17 per cent of the new imprisonments respectively. However, from the principal offence, traffic offences only made up 5 per cent, and narcotic offences as much as 27 per cent of the prisoners at the beginning of the year (see figure 2).
Stable majority of men and most aged 30 years and older
Among the persons imprisoned at 1 January 2013, 95 per cent were male. This is about the same share as in the previous eleven years. Of all prisoners with a known age, 65 per cent were 30 years or older – a share that has been relatively stable since 2006.
Different age groups are imprisoned for different types of offences. Among prisoners under the age of 30, 63 per cent were serving sentences for other offences for profit or violent crime as their principal offence. The corresponding share for prisoners aged 30 years or older was significantly lower, with 42 per cent. From the principal offence, prisoners aged 30 years or older are more often imprisoned for narcotic, economic and traffic offences than in the younger age groups.
29 000 more days in custody
Persons held in custody in 2013 had a total of almost 376 000 prison days in 2013. This indicates that an average of 1 030 people were held in custody each day, which is nearly 9 per cent more than in 2012.
During the year, 4 020 persons in custody detention were discharged; 4 per cent more than in 2012. The average length of a custody detention increased from 2012 to 2013, and this is reflected in the higher increase in the number of custody days than the number of custody detentions.
Primarily, the custody increase is due to an increase in the number of people being held in custody up until the courtroom prosecution of their criminal cases, and the subsequent transfer to serving sentence. Compared to the year before, 2013 saw as much as 11 per cent more transfers from custody to serving a sentence. This is due to custody detention being terminated in this way for 187 more persons of non-Norwegian citizenship. Thus, 58 per cent of all transfers from custody to serving a sentence related to non-Norwegian citizens.
Most served a prison sentence of less than three months
Of the 8 351 prisoners discharged from serving a sentence in 2013, 74 per cent had prison time of less than 90 days. Nearly all of the 2 000 serving time for a traffic offence as their principal offence – as well as two thirds of those serving time for violent or narcotic crimes and 64 per cent of those serving time for other offences for profit – were discharged after less than three months.
Further increase in electronic monitoring
In 2013, there were a total of 1 727 discharges from electronic monitoring (EM) which is 342 more than the year before, and as much as 80 per cent more than in 2011.
Almost half of the persons discharged from EM in 2013 were being sanctioned for violation of the Road Traffic Act as their principal offence, of which 81 per cent were driving under the influence of alcohol. Serving a sentence at home with an ankle monitor is also used for a number of other offences. In 2013, for example, 13 per cent of all those with an EM sanction had an offence of violence as their principal offence.
Fewer days served in prison institutions
In 2013, 12 422 fewer days were served in prison institutions than in 2012. The number of discharges from serving a prison sentence also saw a drop, with 339 fewer prisoners serving a sentence in 2013 than in the year before – a number equal to the increase in the use of EM outside of prison institutions.
More figures from earlier years now available in StatBankOpen and readClose
After changes in processing procedures of the raw data, quality improvement and extended statistics, the 2012 statistics were published in StatBank. Most tables on the prison population per 1 January and discharges have now been updated with figures dating back to 2007. Because of the breaks in time series, no figures from earlier years have been added for new imprisonments and transfers from custody to serving sentence. Tables showing average numbers of prison days and prison population have been updated. These are based on a different source and not affected by the changes from 2012 (see more in About the statistics).
Better raw data material, but break in time series and later statisticsOpen and readClose
The extraction of data from SSP for the 2013 statistics was done in February 2015, as was also the case for the 2012 statistics. There fore, these statistics are a more complete count of the actual occurrences compared to previous years. This is first and foremost the case for the figures on new imprisonments and transfers made directly from custody to serving a prison sentence, and particularly with regard to the most severe crimes with a long processing time in the criminal justice system. Further reading is available in About the statistics, including in the chapter on Sources of error.
Contact
-
Susanne Fjelldalen
E-mail: susanne.fjelldalen@ssb.no
tel.: (+47) 40 90 26 43
-
Kristin Bergvall
E-mail: kristin.bergvall@ssb.no
tel.: (+47) 92 66 55 13
-
Reid Jone Stene
E-mail: reid.jone.stene@ssb.no
tel.: (+47) 99 02 22 01
