Content
Published:
This is an archived release.
Increase in child welfare investigations
The Child Welfare Service initiated a total of 19 200 investigations in 2002, an increase of 550, or 2.9 per cent, compared with 2001. This is the highest figure ever recorded by the Child Welfare Service. More than half of all investigations resulted in the child being put under protection.
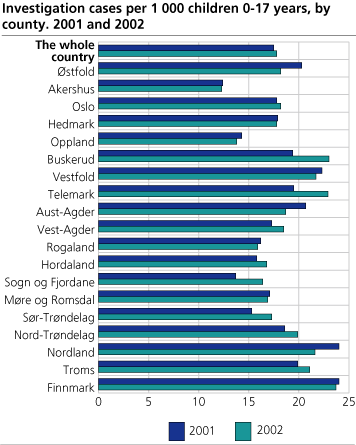
18 investigations per 1 000 children in the age group 0-17 years were initiated in 2002, the same figure as in 2001. The majority of investigations involve boys. For the age group 13-17 years, which is the largest group, 21 investigations per 1 000 children were initiated. A total of 18 850 investigations were closed in 2002. Out of these 53 per cent resulted in the child being put under protection.
Great differences across counties
The statistics reveal considerable differences across counties. Finnmark is on top with 24 investigations per 1 000 children under the age of 18, followed by Buskerud and Telemark with 23 and Vestfold and Nordland with 22. Oppland and Akershus have the lowest number of investigations with 14 and 12 per 1 000 children respectively.
Intervention in more than half of investigations
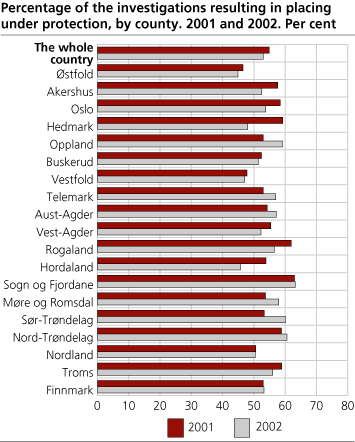
53 per cent of all investigations resulted in the child being put under protection. In 44 per cent of the investigations no further action was taken, while the result is unknown in 3 per cent. In top-ranking Sogn og Fjordane, nearly two out of three investigations (63 per cent) led to the child being placed under protection. In Østfold, the figure was 45 per cent, the lowest figure across all counties.
For 32 per cent of all reports leading to an investigation in 2002, people in the childs social network contacted the Child Welfare Service. The mother or father was by far the largest group in this category, accounting for 23 per cent. Neighbours represented 3 per cent of the reports leading to investigation. Among public institutions, schools (12 per cent) and the Child Welfare Service (11 per cent) were behind most reports of children in need of help. The police and emergency child protection centres accounted for 8 and 7 per cent respectively, while health stations and kindergartens were the reporting body in 6 and 2 per cent respectively.
The statistics only contain data on the person or institution that reported incidents leading to investigations in 2002. In other words, the population does not include all reports to the Child Welfare Service, but only reports leading to investigation. Several people or institutions may be behind one report.
Content of reports
Problems at home/special needs were the most common reasons (55 per cent) for a report leading to an investigation. Behavioural problems and neglect/abuse represented 18 and 21 per cent respectively. The category “Other reasons” represented 20 per cent.
Processing time longer than six months in 5 per cent of investigations
According to the Child Welfare Services Act, all investigations should be undertaken without delay and within three months of a report being made. In special cases the deadline can be extended to six months.
Out of the 18 840 investigations that were closed in 2002, 71 per cent were closed within the three-month deadline. A further 23 per cent of investigations were conducted and closed within six months. For 5 per cent of the investigations the processing time was more than six months. Information is lacking for approximately 1 per cent of the investigations. Average processing time in 2002 was 80 days, against 73 and 74 days in 2001 and 2000.
Tables:
The statistics is published with Child welfare.
Contact
-
Statistics Norway's Information Centre
E-mail: informasjon@ssb.no
tel.: (+47) 21 09 46 42