Further decline of victims of theft, not threats and violence
Published:
In 2018, 9.0 per cent of the adult population reported that they had been victims of incidents of theft, damage, violence or threats of violence during the past year. This is lower than in all previous surveys on living conditions. The share of victims exposed to threats of violence is somewhat larger in 2018.
- Full set of figures
- Victimisation and fear of crime, survey on living conditions
The share of victims of theft is more than halved
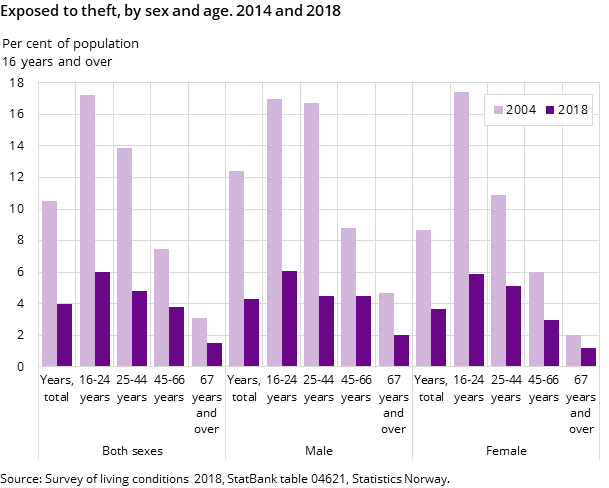
From the surveys carried out in the 1990s and up to 2004, about 10 percent of the adult population reported having been victims of theft in the course of a year. However, this share has decreased during the last four surveys. The Victimisation and fear of crime, survey on living conditions for 2018, 4 per cent reported having been a victim of theft. From 2004-2018, the decline is large for all groups of age and both sexes, as shown in figure 1.
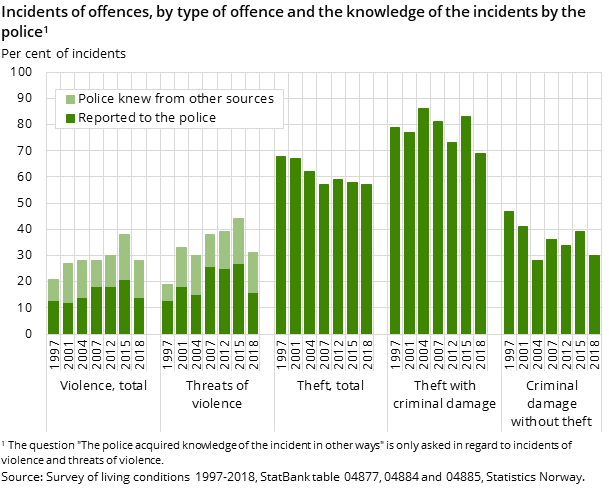
From 2015 to 2018, there is an evenly ditributed decrease for most types of thefts and criminal damage. The thefts and criminal damages the adult population is exposed to are similar as described in the article to the statistics from 2015. For example, about half of all theft and injuries are still committed against homes and cars, and the risk of being a victim of theft is significantly greater for residents of cities than for those living in more sparsely populated areas. The share of the thefts that have been reported to the police are also approximately the same, as seen in Figure 3 later in the article. In recent years, the large declines in thefts are also seen in the statistics on offences reported to the police.
200,000 exposed to violence or threats of violence
In the latest survey from 2018, 4.7 per cent of the population aged 16 and older stated that they during the last year were exposed to one or more incidents of violence or threats of violence. Although, it is is a larger share than in the 2012 and 2015 surveys – where the share was historically low. However, in the latest survey the total extent of victims reporting of violence and threats of violence is less than in all the seven previous surveys (1987–2007).
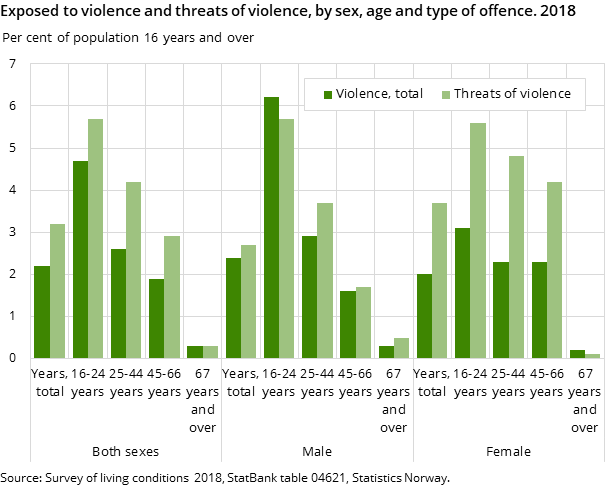
In the 2018 survey (compared with the two previous surveys) a particularly large share report being exposure to threats, as shown in Figure 2. The victim rate among the adult population whose exposed to physical violence is close to the level seen in both 2015 and 2012 – compared to rate in 2007 and in the 1990s its lower – take into account the expected standard errors (in Norwegian only) for this type of surveys.
Figure 2. Exposed to violence and threats of violence, by type of offence
| 1983 | 1987 | 1991 | 1995 | 1997 | 2001 | 2004 | 2007 | 2012 | 2015 | 2018 | |
| Violence or threats of violence, total | 3.8 | 5.2 | 5.1 | 5.4 | 5.5 | 5 | 5.1 | 5.5 | 4.3 | 3.5 | 4.7 |
| Threats of violence | 2.4 | 3.3 | 3.3 | 3.1 | 3.5 | 3.7 | 3.6 | 3.5 | 2.8 | 2.3 | 3.2 |
| Violence, total | 2.3 | 3 | 2.7 | 3.2 | 3.1 | 2.5 | 2.6 | 3.1 | 2.3 | 1.9 | 2.2 |
| Violence that did not led to visible marks or injury | 1.3 | 2.0 | 1.8 | 2.0 | 2.0 | 1.6 | 1.6 | 2.1 | 1.2 | 1.2 | 1.4 |
| Violence that led to visible marks or injury | 1.3 | 1.6 | 1.3 | 1.7 | 1.8 | 1.3 | 1.5 | 1.7 | 1.4 | 1.2 | 1.3 |
Several non-reported violent offenses
In the period 2007–2015, we also see decreases for some types of violence and threats of violence. The decreases are specially seen among young men, in the statistics on police-reported offences, victims and persons charged. However, these crime statistics indicates there is no clear increase in violence or threats for recent years. The fact that we find a somewhat different tendency in the survey is partly related to an increase in non-reported incidents of both violence or threats in 2018 compared to the three previous surveys - as illustrated in Figure 3.
One in ten young men exposed to violence or threats of violence
In all previous surveys both sexes aged 16-24, expose a much higher share of victims of violence than older age groups. However, the patterns of victimization of violence and threats, are unequally distributed among different ages and sex.
For example, among those aged 25-66, women are far more than men exposed to threats of violence, as shown in Figure 4. In nearly all previous surveys, the same picture is shown for the young women aged 16-24 years. However, in 2018 survey, male victims reported threats of violence at nearly equal share as female victims in the youngest group of age.
Compared to 2015, one of the largest increase for victims of violence are by men aged 16-25 years. Overall, 9.6 per cent of all men in this group of age reported in the 2018 survey their having been exposed to threats of violence. This is a larger share than in 2015, where the share was 6.4 per cent. However, the extent of violence and threats of violence among young men is still far lower than in the survey from 2007, where as many as 17.3 per cent of all men aged 16-24 stated that they had been victims of violence or threats of violence.
More work related victimization, especially among men
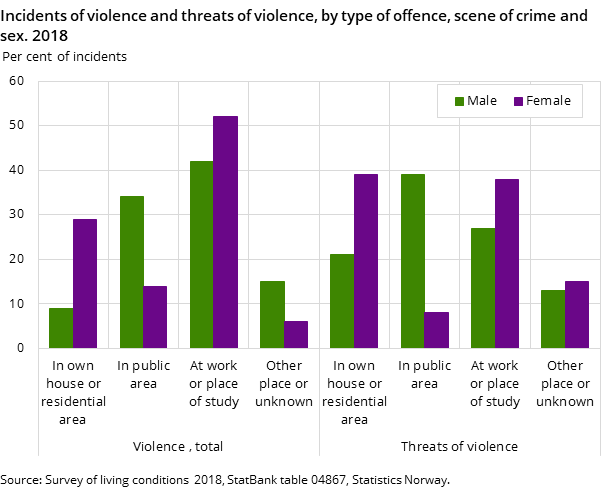
The survey on living conditions maps types of violence and threats from different circumstances and times of day – and in situations between persons with various types of relationships. In the last three surveys, about half of all incidents of violence against women happened at work or place of study. The fact that a larger share of employed women than employed men are victims of violence and threats of violence at work, is also described in all survey on working environment during the period 1989–2016.
However, the extent of violence and threats of violence to men at work is far greater in 2018 than in all previous years. In as much as 42 per cent of all violence reported to men happened at work, as shown in figure 5. The increased reporting of this type of violence also contributed significantly to the overall extent of violence and threats being greater than in the 2015 survey.
Men and women are still victims of some different types of violence
The fact that the work-related violence now constitutes a larger part, also gives other changes in the statistics on incidents of violence to which the adult population is exposed, for example in the descriptions of the characteristics of the perpetrators who have committed the acts of violence. The mapped incidents of violence in 2018 also have a somewhat different distribution on weekdays and time of day.
Despite the changes that have taken place in recent surveys, there are still some differences among men and women. As in most previous surveys on living conditions, it is also in 2018 that a larger proportion of the violence against men occurs in public places, at night, on weekends and by an intoxicated offender. In addition, a greater share of all violent incidents against men, are still comitted by a completely unknown offender. A larger share of the incidents of violence by women occur in private living environments, and by not intoxicated offender.
A large share of single parents have experienced violence and threats
The fact that the family situation can have a relatively large impact for both sexes was mapped in a separate analysis of the living conditions surveys, for the period 1997-2004 (in Norwegian only). As previously described, there are larger shares of victims among singles than those who live in other family-cycles. In addition, single parents differ even more than before as a group particularly exposed to violence and treats. Of all single parents, 7 per cent were exposed to violence, and about a tenth exposed to threats of violence shows the last two surveys (2015 and 2018).
Contact
-
Reid Jone Stene
-
Lotte Rustad Thorsen
-
Statistics Norway's Information Centre


