Content
Published:
This is an archived release.
Continued increase in house prices
House prices increased by 5.3 per cent from the first quarter of 2009 to the second quarter of 2009.
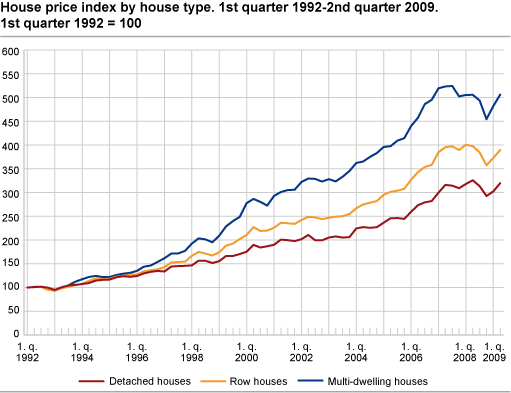
While flats in blocks became 4.9 per cent more expensive between the first quarter and the second quarter this year, the prices of detached houses and row houses increased by 5.7 and 4.5 per cent respectively. Prices of flats in blocks are unchanged compared with the same period last year, while prices of row houses and detached houses are about 2 per cent lower than in the second quarter of 2008.
|
1st quarter 2009-
2nd quarter 2009 |
2nd quarter 2008-
2nd quarter 2009 |
||||||||||||||||||||||||||||||||||||||
|---|---|---|---|---|---|---|---|---|---|---|---|---|---|---|---|---|---|---|---|---|---|---|---|---|---|---|---|---|---|---|---|---|---|---|---|---|---|---|---|
| Total | 5.3 | -1.5 | |||||||||||||||||||||||||||||||||||||
| Oslo incl. Bærum | 6.9 | -0.6 | |||||||||||||||||||||||||||||||||||||
| Stavanger | 3.1 | -5.2 | |||||||||||||||||||||||||||||||||||||
| Bergen | 4.9 | -5.1 | |||||||||||||||||||||||||||||||||||||
| Trondheim | 3.5 | -3.1 | |||||||||||||||||||||||||||||||||||||
| Akershus excl. Bærum | 3.2 | -4.9 | |||||||||||||||||||||||||||||||||||||
| South Eastern Norway | 5.1 | -0.8 | |||||||||||||||||||||||||||||||||||||
| Hedmark and Oppland | 4.0 | -1.4 | |||||||||||||||||||||||||||||||||||||
| Agder and Rogaland excl. Stavanger | 3.2 | -3.3 | |||||||||||||||||||||||||||||||||||||
| Western Norway excl. Bergen | 7.4 | 3.5 | |||||||||||||||||||||||||||||||||||||
| Trøndelag excl. Trondheim | 4.5 | 0.0 | |||||||||||||||||||||||||||||||||||||
| Northern Norway | 7.5 | -0.5 | |||||||||||||||||||||||||||||||||||||
Sharpest increase in Northern Norway and Western Norway
The price development in Norway varies between the different regions. Northern Norway and Western Norway excluding Bergen had the strongest increase in the second quarter of 2009, with 7.5 and 7.4 per cent respectively. Among the larger cities, Oslo including Bærum had the strongest rise in house prices, of 6.9 per cent. Stavanger was the region with the lowest price growth, at 3.1 per cent.
Revised calculation modelAs from 2009, the house price index is solely based on data from Finn.no. The number of indices has been expanded to include 11 regions, of which four are cities. There are no longer separate indices for cooperative and freeholder houses. The tenure status is instead included as an explanatory variable in the regression equations. The regression equations, used in the index calculations, are expanded by more price zones in all the regions. In addition, new explanatory variables are used: the construction year of the house, if it is situated in a sparsely or densely populated area and centrality of the municipality. The value of the housing stock is used as weights to calculate the total indices for the country, regions, cities and house types. (This method of weighting has been in use since 2002.) Changes in publicationNew figures are calculated back to 2005 and the indices are now published with 2005 = 100. With some exceptions, indices for all three house types are published, including a total index for all regions. The exceptions are Hedmark and Oppland, Trøndelag excluding Trondheim and North of Norway. For these regions, the index for row houses is not published due to the small number of sales and thus a high degree of uncertainty. The timeliness of the statistics will be improved. Publication is planned to take place approximately 15 days after the end of the relevant quarter. Average square metre prices will still be published for both freeholder and cooperative houses. |
|
Average square metre prices and the complete time series can be found in the StatBank . A total of 19 821 house sales are used in the index computation for the second quarter of 2009. |
Tables:
Contact
-
Per Medby
E-mail: per.medby@ssb.no
tel.: (+47) 90 24 11 27
-
Mona Takle
E-mail: mona.takle@ssb.no
tel.: (+47) 40 81 14 12