Content
Published:
This is an archived release.
Slight decrease in emission intensity
The emission intensity for greenhouse gases has decreased steadily since 1990. From 2006 to 2007, the decrease was smaller than earlier years. The industries emitting most - transport and extraction and mining - both increased their emissions more than their output.
In a sustainability perspective, one goal is to change the content of economic growth in such a way that the environmental pressure does not follow the growth of the economy. Linking emission statistics with national accounts shows whether Norway as a whole or the different industries have become more or less emission-intensive over time. The emission intensity falls if the economic activity grows more than the emissions.

In this article, economic activity is measured in output (in fixed 2000-prices).1Emission intensities are for the first time also published in StatBank.
Emission intensity continues to decrease
Greenhouse gas emissions for Norway have increased since 1990, but the growth in output has been even higher. The emission intensity for Norwegian industries dropped 42 per cent from 1990 to 2007. However, the curve levelled out from 2005-2007. The emission intensity level in 2005 and 2006 amounted to 21 tonnes of CO2 equivalents per million NOK output. From 2006-2007, the emission intensity dropped 2.3 per cent and 2007 had the lowest level of emission intensity since 1990.
The reasons behind the decreasing emission intensity are mainly economic growth in industries that have low intensities, more efficient use of fossil fuels, as well as different environmental initiatives. However, despite the reduction in emission intensity, Norwegian greenhouse gas emissions have risen by 6.82 per cent since 1990.
Less emissions from households
Whilst household’s greenhouse gas emissions in 2007 were below the 1990 level, this was not the case for industries in total. Households have decreased their greenhouse gas emissions from 14 to 6.8 tonnes of CO2 equivalents per million NOK (consumption in households). Emission from households broadly consists of use of cars, whilst all emissions from the production of goods and services that households consume belong to the industries producing the good or service. Emissions from goods and services produced abroad and consumed in Norway, are not included in the Norwegian emissions data. Emission intensity for households has declined more than for the industries in the last year.
Increasing emissions from extraction and mining industry
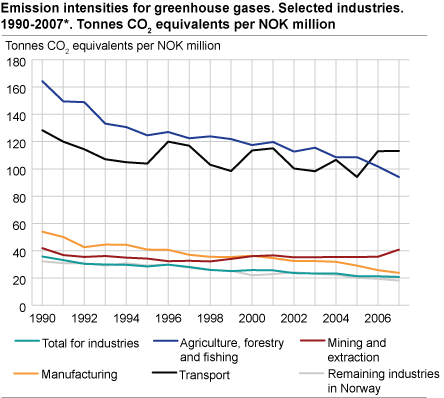
Transport, agriculture, forestry and fishing and extraction and mining have the highest emission intensities for greenhouse gases. Looking at aggregated level, most industries are less emission-intensive compared to 1990. The emission intensity for agriculture, forestry and fishing declined from 2006 to 2007, with the largest decline within fishing.
Extraction and mining is an important exception. After a decline up to 1996, the emission intensity has risen. This is due to a change-over from oil extraction to more gas extraction, giving higher emission per unit output, and also some oil fields moving into the last phase where more energy is needed to extract the oil. In 2007, the emission intensity in extraction and mining was again at the level of 1990, due to the particularly high emissions from the LNG installation at Melkøya outside Hammerfest.
Emission intensity for other land transport constantly increasing
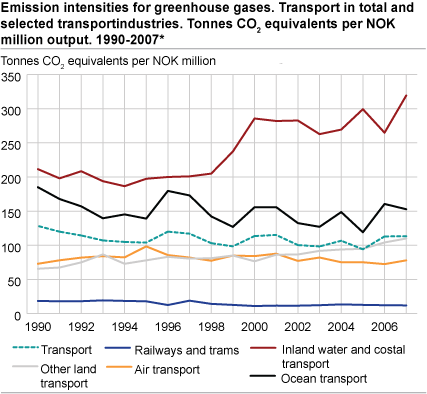
Transport is responsible for almost one third of the total greenhouse gas emissions in Norway. Surpassing agriculture, forestry and fishing in 2006, the emission intensity within transport is the highest of all industries, with 113 tonnes of CO2 equivalents per million NOK output. After a steady increase in emission intensity from 2005 to 2006, the intensity in 2007 was nearly the same as in 2006. Emission intensity for other land transport (scheduled motor bus transport, taxi operation and other land transport) has risen strongly by 67 per cent since 1990.
Inland water and costal transport have the highest emission intensities amongst the transport industries, and also compared to other industries on a detailed level. Ocean transport is responsible for the major part of greenhouse gas emissions from the transport industries (57 per cent). However, calculations from ocean transport are uncertain and show large fluctuations from year to year.
Tables:
Additional information
Contact
-
Ingrid Semb Weyer
E-mail: ingrid.semb.weyer@ssb.no
tel.: (+47) 40 90 23 51
-
Trine Heill Braathu Randen
E-mail: trine.heill.braathu.randen@ssb.no
tel.: (+47) 91 10 67 45