Content
Published:
This is an archived release.
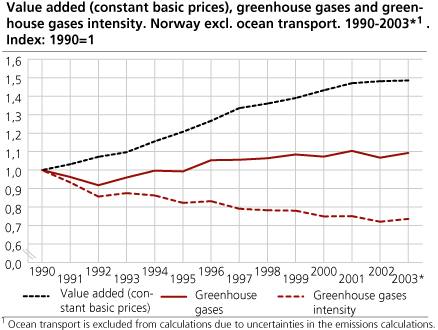
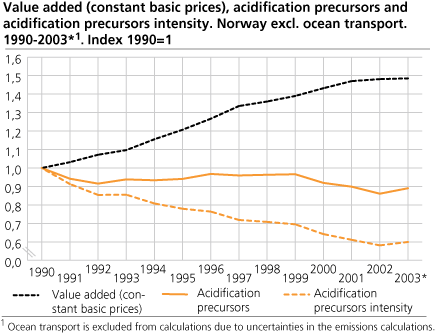
Emissions increased more than value added
Emissions of greenhouse gases and acidification precursors have increased more than value added for the first time in a number of years. Emissions of CO2 have increased in particular due, among other reasons, to higher levels of natural gas production, increased use of light fuel oils, as well as increased emissions from road transportation and coastal shipping.
These are some of the results Statistics Norway obtained by combining data from the national accounts and environmental statistics for the period 1990 to 2003.
The Norwegian authorities have a goal that the economy will continue to grow but at the same time there will be a reduction in the environmental consequences due to these economic activities. A reduction in emissions intensity can be obtained either by having the various industries become more environmentally effective (i.e., pollute less per NOK value added), or by a structural change in the economy where less polluting industries become increasingly more important at the expense of more polluting industries.
In previous years most industries showed a positive development, even though total levels of pollution did not go down, there was at least less pollution in relation to value added created. In 2003 this was not the case. Emissions of both greenhouse gases and acidification precursors increased in relation to the previous year, and they increased more than value added. Whether this is a change in the overall trend is not yet certain. Changes in emissions intensity have also gone in undesirable directions for short periods earlier. However, the long-term trend has been gradually decreasing for the emissions intensity for greenhouse gases. Some of the primary reasons for the emissions increase in 2003 were higher natural gas production, greater use of light fuel oil instead of electricity, plus an increase in road transportation and coastal shipping
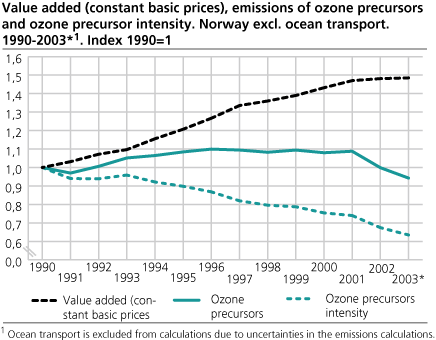
Lower levels of ozone precursors
For one area, however, the changes were in the desired direction: emissions of ozone precursors went down both in total amount and in relation to value added. In 2003 more than half of the emissions of volatile organic compounds (NMVOC) arose from the loading and storage of crude oil on oil platforms. Since more of the oil was transferred using equipment that recycle oil fumes, it was possible to obtain these reductions. The decrease in ozone precursors in 2003 was also due to recycling units for crude oil fumes that were installed in land-based plants, lower sales of gasoline and an increase in the percentage of automobiles with catalytic converters. Emissions reached a peak in 2001 and in 2003 emissions fell for the first time under the 1990-level.
Nuances in this picture
There are nuances in this picture, depending on whether one views Norway from a geographic or economic perspective. Between 1990 and 2003, Norway’s total economic activity (including ocean transport) had a 48 per cent increase in total value added (measured in constant basic prices) and a 4 per cent increase of greenhouse gas emissions. During the same time period there was a 17 per cent reduction of acidification precursors and an 8 per cent reduction of ozone precursors. The graphs show the trends for Norway excluding ocean transport. Total value added had about the same increase, while greenhouse gas emissions increased by 9 per cent. On the other hand, acidification precursors decreased by 11 per cent and ozone precursors decreased by 6 per cent.
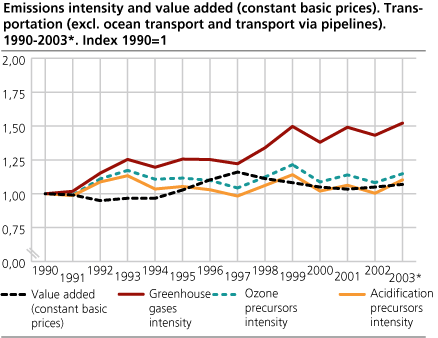
Transportation industry contributed the most
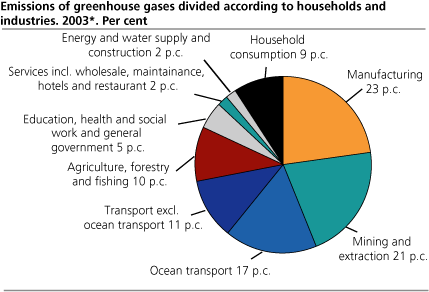
The transportation industry accounted for 28 per cent of greenhouse gas emissions in 2003. This industry was the largest contributor to greenhouse gas emissions. Calculations show that ocean transport alone contributed 17 per cent of total greenhouse gas emissions, in other words, more than the emissions from all inland transportation industries.
The emissions data for ocean transport have a high level of uncertainty. Fewer resources have been used to develop good methods for calculating these emissions, since they are not included in the major environmental air emissions agreements such as the Kyoto protocol or the Gøteborg protocol.
and was also the most pollution intensive
The transportation industry contributed 6 per cent of total value added in 2003. This made the transportation industry the most greenhouse gas intensive industry, with the most greenhouse gas emissions in relation to total value added. Ocean transport accounted for 17 per cent of greenhouse gas emissions but contributed only 1 per cent of total value added.
In the transportation industry - excluding ocean transport and pipeline transport - greenhouse gas intensity has shown a relatively stable downward trend since 1999, and has been under the 1990-level for several years. The development in the last year shows an opposite or increasing trend. This is mainly due to increased emissions from diesel trucks and coastal transport.
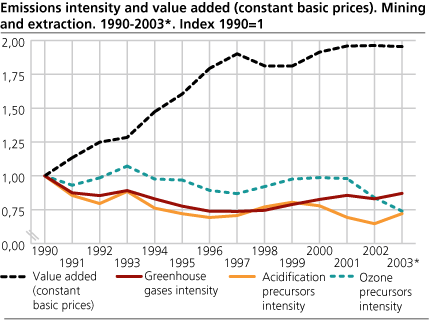
Increase in natural gas production gave greater emissions
The mining and extraction industry had a relatively even reduction in greenhouse gas intensity between 1990 and 1997-98. After that it appears that the trend has changed. The change from oil production to more natural gas production has contributed to greater emissions of both greenhouse gas emissions and acidification precursors without having an increase in value added due to this structural change. This increase in emissions is because natural gas production is more energy intensive than crude oil production and is therefore more polluting.
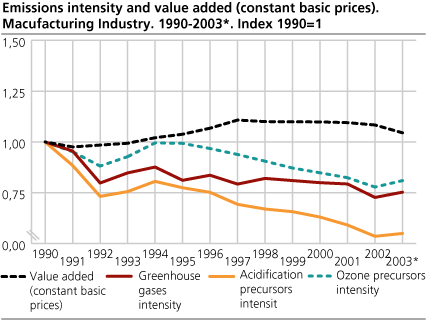
More heating oil instead of electrical power in the manufacturing industry
High electricity prices in 2003, resulted in more light fuel oil being used than electrical power in a number of land-based industries. Emissions of both greenhouse gases and acidification precursors increased from 2002 to 2003 and this change is due primarily to an increased use of light fuel oil.
There are some specific industries where the trend for emissions went in the opposite and desirable direction. For example, greenhouse gas emissions from aluminium production went strongly down from 2002 to 2003 in spite of increased production. The reason for this reduction is primarily a change from the so-called Søderberg technology to the “pre-bake” technology at one plant. Prebake is less emissions intensive than Søderberg.
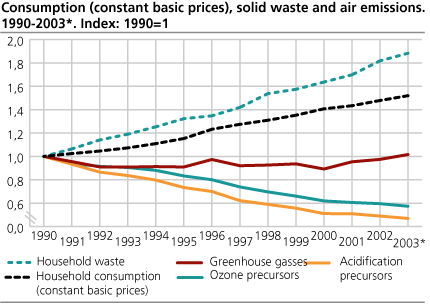
Household waste continues to increase
For households it is most relevant to use consumption as an indicator for economic development. In addition to air emissions data, there are also statistics for solid waste from households. The statistics show that households' waste production continued to increase more than consumption, in spite of the politically established environmental goals to the contrary.
Households’ greenhouse gas emissions also increased for the first time over the 1990-level. This is primarily because of the increased use of heating oil but there was also an increased use of gasoline in privately owned cars. Emissions of acidification precursors and ozone precursors continued to go down, which is explained primarily by the fact that catalytic converters are now installed in most of the automobile fleet.
Additional data from the Norwegian Environmental Accounts are available at StatBank .
|
Environmental Accounts: Different definitions
This article is based on environmental satellite accounts of the NAMEA type (NAMEA: National Account Matrix including Environmental Accounts, for further information consult ' About the statistics '). There are essential differences between the Norwegian NAMEA emissions data and the national data on air emissions that are published by Statistics Norway and the Norwegian Pollution Control Authorities (SFT). The national air emissions data set is distributed by source (such as process emissions, stationary and mobile combustion), independent of which industries that are doing the activity. The data set is based on a geographic definition of Norway, excluding activities not on national territory even when done by units that are resident in Norway. This means that ocean transport and international air transport are excluded. The NAMEA data are distributed by industry, so as to enable a comparison of economic activity and environmental impacts. NAMEA-data uses an economic definition of Norway, which is the same as the one used for the national accounts, and is not strictly observing the geographical borders of mainland Norway. A consequence is that Ocean transport, which is an important part of the Norwegian GDP, should be included. In the results shown in this article, we have had to make some exceptions to this, as the assessment of emissions from this industry is particularly uncertain. These emissions are, however, included in the pie graph above to show the importance of the industry. |
Tables:
Additional information
Contact
-
Ingrid Semb Weyer
E-mail: ingrid.semb.weyer@ssb.no
tel.: (+47) 40 90 23 51
-
Trine Heill Braathu Randen
E-mail: trine.heill.braathu.randen@ssb.no
tel.: (+47) 91 10 67 45