Content
Published:
This is an archived release.
Continued decrease in greenhouse gas emissions per produced NOK
The growth in the Norwegian economy in 2014 did not lead to corresponding growth in greenhouse gas emissions. The greenhouse gas emissions remained at approximately the same level as the previous year, which means that the emissions per produced NOK decreased in 2014.
| 2013 | 2014 | Change in per cent | ||
|---|---|---|---|---|
| 2013 - 2014 | Since 1990 | |||
| Output in constant 2005 prices. NOK million | 3 699 492 | 3 792 759 | 2.5 | 102.2 |
| Greenhouse gas emissions. 1 000 tonnes CO2-equivalents | 56 461 | 56 159 | -0.5 | -6.2 |
| Emission intensity for greenhouse gases. Tonnes CO2-equivalents/output in NOK million | 15.2619 | 14.8069 | -3.0 | -53.6 |
![Figure 1. Total greenhouse gas emissions (CO2-equivalents], output (fixed 2005-prices] and emission intensity for Norwegian economic activity (excl. households) Figure 1. Total greenhouse gas emissions (CO2-equivalents], output (fixed 2005-prices] and emission intensity for Norwegian economic activity (excl. households)](/en/natur-og-miljo/statistikker/nrmiljo/aar/_image/250536.png?_encoded=2f66666666666678302f35382f&_ts=151b54f8fc8)


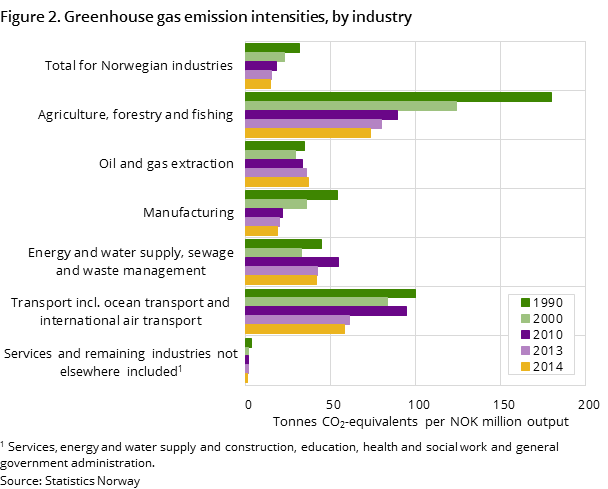
The emission intensity for greenhouse gases decreased by 3 percent in 2014 for the Norwegian economy as a whole, and was measured as 14.8 tonnes of CO2 equivalent per million produced in 2014. 2014 is the fourth consecutive year of decline in the emission intensity. As in previous years, the decrease in emission intensity in 2014 can be attributed to a relatively high growth in the less emission-intensive service industries compared to other industries. However, a decline in the emission intensity in the manufacturing industries, ocean and coastal water transport, as well as land transport also contributed to the overall decrease in the emission intensity. Increased emission intensities in the oil and gas extraction industry curbed the overall decrease in the emission intensity.
Large variations between industries
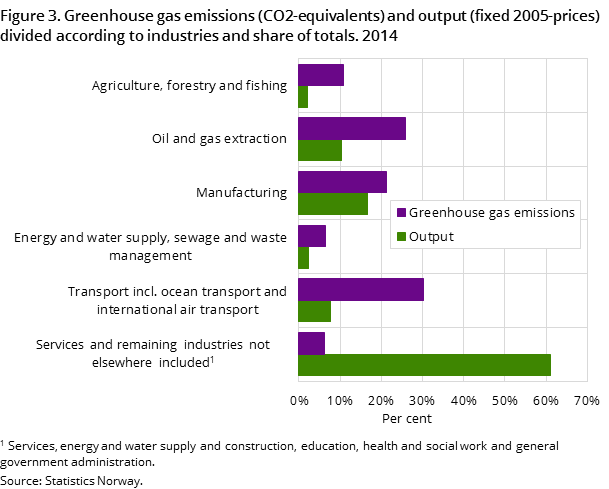
There is not necessarily any correlation between the industries that contribute to growth in production and emissions of greenhouse gas respectively. The 2.5 per cent growth in the Norwegian economy in 2014 was mainly due to growth in the service sectors, manufacturing industries and the oil and gas extraction industries. The greenhouse gas emissions (measured in CO2 equivalents) related to this economic activity decreased by 0.5 per cent, totalling 56.2 million tonnes of CO2 equivalents. The decrease in emissions from the manufacturing industries and the transport industries made a particular contribution to the total decrease in greenhouse gas emissions, while the emissions in the oil and gas extraction industries pulled in the opposite direction.
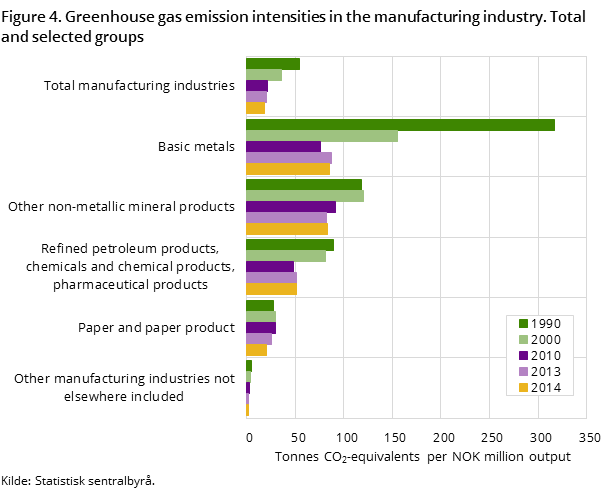
The transport industries, primary industries, production of basic metals and other non-metallic mineral products have the highest emissions per produced NOK. The oil and gas extraction industry is not among the industries with the highest emission intensities, but due to a high activity level they still make a large contribution to total emissions of greenhouse gases.
The emission intensity in the manufacturing industries continues to fall
The emission intensity for the Norwegian manufacturing industries was reduced by 6.1 per cent in total from 2013 to 2014. This was mainly due to an increase in production in the manufacturing industries that make a relatively small contribution to the greenhouse gas emissions.
A fall in production (measured in 2005 prices) in refined petroleum, chemical and pharmaceutical products, which account for 42 per cent of the greenhouse gas emissions in the manufacturing industry, led to a decrease in emissions. The emission intensity did not change much in 2014 compared to 2013. The increase in emission intensity in the production of other non-metallic mineral products also curbed the overall decrease in emission intensities in the manufacturing industries.
Emission intensity in the oil and gas extraction industries continues to increase
The total greenhouse gas emissions per produced unit of oil and gas (as measured in constant 2005 prices) has increased since 1990. However, there are huge disparities between the different oil fields. Compared to 2013, the total production (measured in fixed 2005 prices) in the oil and gas extraction industries increased by 1.7 per cent. The greenhouse gas emissions increased by 4.8 per cent. In 2014, the total greenhouse gas emissions per produced NOK in the oil and gas extraction industry therefore also increased.
Decline in the emission intensity for the transport sector as a whole
The picture for the transport sector is complex. The transport sector contains different transport industries with large variations in both the level and development of their emission intensities. The emission intensity decreased in 2014 compared to 2013 in all the transport industries except air transport.
The emission intensity for the Norwegian economy has improved since 1990
The emission intensity for greenhouse gases for the Norwegian economy has steadily decreased since 1990 and has been reduced by almost 50 per cent, reaching a level of 14.8 tonnes of CO2 equivalents per produced unit (as measured in constant 2005 prices) in 2014. The reduced emission intensity in Norway is partly due to technological advances, changes in the mix of energy products used, a shift towards more energy-efficient production and structural changes. A shift from the use of fossil fuels towards fuels based on renewable sources is also helping to reduce emissions. Structural changes in the economy, for example a shift from manufacturing industries to service industries, also have the same effect.
Uncertainty in the estimations of emissions from ocean transportOpen and readClose
The definitions used in the national accounts are also used in the estimation of emissions from Norwegian economic activity. Ocean transport and international air transport are therefore included. Ocean transport’s 9.9 per cent contribution towards the total greenhouse gas emission coupled with just 1.7 per cent of the total production makes it distinct from other industries in the Norwegian economy.
Ocean transport is one of the industries with the highest emission intensity for greenhouse gas emissions. The calculations of emissions from ocean transport are, however, particularly uncertain.
Revision in figures for 2013Open and readClose
Preliminary figures for emissions, production and emission intensities for 2013 have been published earlier. Figures for 2013 have now been revised. The figures for 2014 are still preliminary. The production figures for 2013 have been adjusted down by 0.3 per cent, while emissions of greenhouse gases have been adjusted down by 5.4 per cent. This is mainly due to a downward revision of emissions in ocean transport. Total emissions of greenhouse gases not including ocean transport in 2013 have been downward adjusted by 0.7 per cent.
Decomposition analyses of emissions to airOpen and readClose
As part of the calculation of emission intensities, decomposition analyses are also done. The decomposition analyses show the development of the greenhouse gas emissions as the combined effects of the change in five factors, which are the fuel mix, production energy intensity, industry composition, total production value in the Norwegian economy and other factors such as production Technology.
Additional information
Contact
-
Ingrid Semb Weyer
E-mail: ingrid.semb.weyer@ssb.no
tel.: (+47) 40 90 23 51
-
Trine Heill Braathu Randen
E-mail: trine.heill.braathu.randen@ssb.no
tel.: (+47) 91 10 67 45
