Content
Published:
This is an archived release.
Emissions increased more than production
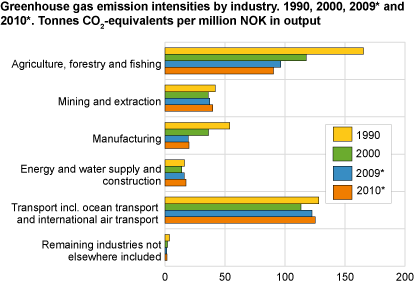
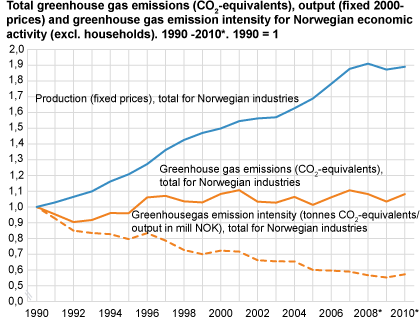
From 2009 to 2010, greenhouse gas emissions from Norwegian industries increased more than the growth in production. Despite a moderate increase in 2010, the greenhouse gas emission intensity has levelled out in recent years and is at a historically low level.
The decline from 2008 to 2009 in output, greenhouse gas emissions and intensity (measured as emissions of greenhouse gas per million kroner output) due to the financial crisis has so far not resulted in any new trends in the relation between output and greenhouse gas emissions. The preliminary data are split into 9 different industry groups in addition to households, and give an early general picture of the relation between economic growth and greenhouse gas emissions. However, it is a multi-facetted picture and there are major differences both within and between the industry groups.
Preliminary data for 2010 for greenhouse gas emission intensities for Norwegian economic activity are now published by Statistics Norway.
Compared with the national emission figures that are reported as part of the Kyoto agreement and calculated using a territorial definition of Norway, the figures presented here also include emissions to air from ocean transport and international air transport.
In 2010, the production (measured in fixed prices) grew by 1.0 per cent. The increase in production is mainly due to higher activities in the less emission intensive service industries. Additionally, the production in the more emission intensive manufacturing industries and transport industries grew in 2010, and it is the higher activity in these industries that made the largest contribution to the increase in the greenhouse gas emissions by 4.6 per cent from Norwegian industries in 2010.
The greenhouse gas emission intensity from Norwegian industries in total grew by 3.6 per cent from 2009 to 2010, reaching a level of 20.5 tonnes CO2-equivalents per million kroner produced in 2010. The increase in 2010 must be viewed in relation to the historically low level seen in 2009, which was a result of low activity in the least emission intensive industries due to the financial crisis. For all industry groups, with the exception of the primary industries, the increase in the greenhouse gas emissions was higher than the increase in production (measured in fixed prices).
Oil, gas and transport behind increase in the greenhouse gas emission intensity
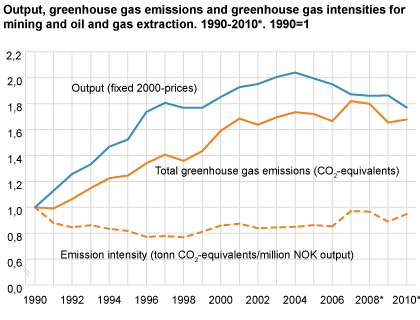
The output (measured in fixed prices) in the extraction industry decreased in 2010 by 5 per cent, mainly due to a drop in the oil production by nearly 10 per cent. The production of natural gas showed a slight increase. An increase in the oil and gas activities on land contributed to an increase in the greenhouse gas emissions from the extraction industry by 1.4 per cent in 2010. The greenhouse gas emission intensity for the extraction industry therefore grew by 6.5 per cent to 39.8 CO2-equivalents per million kroner produced in 2010.
The transport industry is composed of industries that are very different with regard to greenhouse emissions and production level. In 2010 it is particularly the freight and passenger traffic on land and at sea that contributes to the increase in production (measured in fixed prices) and in greenhouse gas emissions. The greenhouse gas emissions grew in general more than the increase in output, resulting in an increase in the greenhouse gas emission intensity by 2.4 per cent in 2010.
Increase in the greenhouse gas intensity in manufacturing industries
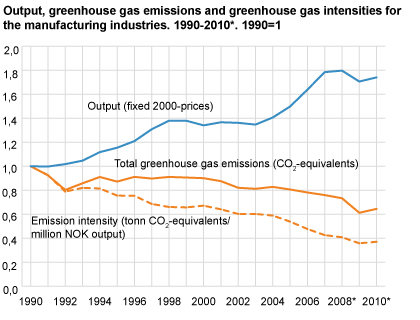
Both greenhouse gas emissions and production (measured in fixed prices) in the manufacturing industries increased in 2010. The greenhouse gas emissions generally increased the most, resulting in an increase in the overall greenhouse gas emission intensity for the manufacturing industries of 3.5 per cent.
The increase in the production activities in the manufacturing industries is mainly due to an increase in the output of basic chemicals, metals and wood and paper products. The rest of the manufacturing industries have a mainly lower activity level than the previous year. It is mainly the increased activity in the production of basic chemicals and metals that is the reason for the growth in greenhouse gas emissions from the manufacturing industries.
Revised detailed figures for 2008 and 2009Detailed figures for emission intensities for 2008 and 2009 are revised due to new information in the quarterly national accounts for these years. This has not resulted in any major revisions in the emission intensities for Norwegian industries in 2008, but for 2009 the greenhouse gas emission intensity was adjusted upwards by 0.6 per cent. The revision in 2009 is mainly due to new information within the construction industry. |
Tables:
Additional information
Contact
-
Ingrid Semb Weyer
E-mail: ingrid.semb.weyer@ssb.no
tel.: (+47) 40 90 23 51
-
Trine Heill Braathu Randen
E-mail: trine.heill.braathu.randen@ssb.no
tel.: (+47) 91 10 67 45


