Content
Published:
This is an archived release.
Stabilised emissions of hazardous substances
Norwegian emissions to air of hazardous substances have been comparatively stable during recent years. In a wider timeframe, however, there has been a significant reduction, in accordance with national targets and international obligations.
Emissions to air for the period 1990-2007 have been calculated by Statistics Norway in close collaboration with the Norwegian Pollution Control Authority.
Decrease for most emissions since 1995
As a national target, Norway intends to reduce the emissions compared to the level in 1995. This has been achieved for emissions of most hazardous substances. PAH, and particularly copper are, however, important exceptions.
The decrease since 1995 is mainly due to emission reductions in manufacturing industries and mining. Improved treatment systems and manufacturing processes, combined with lower activity in some industries, have led to emission reductions. Phasing out of leaded petrol has caused a dramatic decrease in emissions of lead from road traffic in the period 1990 to 1996. Fluctuations in emission levels may be effected by measuring uncertainty.
|
Hazardous substances are non-degradable chemical compounds that are not a natural part of nature. They may enter the food chain and cause significant damage to health and the environment. Transported by air or water, hazardous substances can be spread over large distances. Important hazardous substances are heavy metals (such as lead, cadmium and mercury) and dioxins and PAH (polycyclic aromatic hydrocarbons). Dioxins are a collective term for a group of chlorous toxicants created by incomplete combustion or heating of chlorine-containing organic material and which also may be formed as a by-product in some industrial processes. PAH is a by-product created by incomplete combustion or heating of organic materials such as oil, natural gas, coal and fuel wood. |
National and international obligationsReport No. 14 (2006-2007) to the Storting presents new national targets for reductions in emissions of hazardous substances by 2010 from the 1995 level. The report lists 25 substances/groups of substances of which emissions shall be eliminated or substantially reduced (50-90 per cent reduction). These reductions comprise emissions to air, water and earth, but the targets are not specified for each category. The figures presented in this article only include emissions to air. Through various international agreements, Norway has committed to reducing its emissions to air of certain hazardous substances from the 1990 level. Different protocols under the Convention on Long-Range Transboundary Air Pollution (CLRTAP) set out the targets for emissions with regional effects. One of these protocols, the Aarhus Protocol, stipulates the commitments for the reduction of PAH and dioxins, lead, cadmium and mercury. For copper, chromium and arsenic, there are no commitments, but there are requirements for reporting emissions. |
| 2007 |
Per cent change
1990-2007 |
Per cent change
1995-2007 |
Per cent change
2006-2007 |
||||||||||||||||||||||||||||||||||||
|---|---|---|---|---|---|---|---|---|---|---|---|---|---|---|---|---|---|---|---|---|---|---|---|---|---|---|---|---|---|---|---|---|---|---|---|---|---|---|---|
| Lead, kg | 7 623 | -96 | -68 | 6 | |||||||||||||||||||||||||||||||||||
| Chromium, kg | 2 244 | -82 | -80 | -14 | |||||||||||||||||||||||||||||||||||
| Arsenic, kg | 1 629 | -48 | -45 | 23 | |||||||||||||||||||||||||||||||||||
| Mercury, kg | 691 | -54 | -21 | 7 | |||||||||||||||||||||||||||||||||||
| Cadmium, kg | 557 | -50 | -43 | -7 | |||||||||||||||||||||||||||||||||||
| Copper, kg | 22 243 | 1 | 17 | 4 | |||||||||||||||||||||||||||||||||||
| Dioxins, mg | 23 482 | -82 | -66 | -1 | |||||||||||||||||||||||||||||||||||
| PAH, kg | 130 284 | -17 | -13 | -16 | |||||||||||||||||||||||||||||||||||
| Particulates, tonnes | 50 397 | -28 | -26 | -6 | |||||||||||||||||||||||||||||||||||
|
Source:
Emission inventory from Statistics Norway and Norwegian Pollution Control
Authority. |
PAH emissions: annual variations, but stable over time
The reduction in PAH emissions from 2006 to 2007 was mainly due to lower process emissions from the production of aluminium; for these emissions, however, there are large annual variations. The decrease in total emissions does not reflect a trend; the emissions in 2006 were higher than in 1995. Aluminium production caused 49 per cent of the emissions in 2007, compared to 37 and 38 per cent in 1990 and 1995 respectively, and has, accordingly, had greater significance for the total emissions during the period. Although the emissions from this source vary between years, the level has in later years been higher than in the 1990s. The second most important source of Norwegian PAH emissions in 2007 was the combustion of fuel wood, which caused 26 per cent of the emissions. Road traffic (7 per cent) and solvents (6 per cent) were other important emission sources.
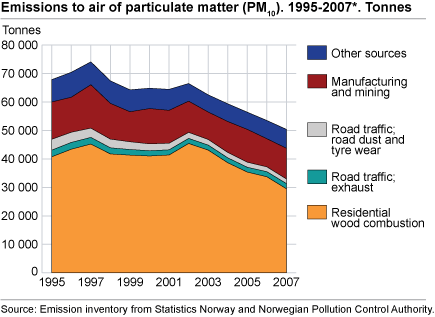
Emissions of particulate matter are decreasing
A total of 58 per cent, or 29 500 tonnes, of the missions of particulate matter in 2007 came from use of fuel wood. The emissions from this source have been reduced by 13 per cent since 2006, mainly because of the reduction in the use of fuel wood, but also partly because a larger share of the wood was combusted in new, less polluting stoves. Process emissions from manufacturing industries and mining contributed with 21 per cent of particulate matter emissions in 2007, whereas motorised equipment and road dust and tyre wear were responsible for 6 and 4 per cent respectively.
Most heavy metal emissions stable after previous decrease
Lead
There was a significant reduction in emissions from lead during the first half of the 1990s due to the phasing out of leaded petrol. From 1996, the decrease has been more modest. A total of 90 per cent of the total emissions in 1990 were combustion emissions from road traffic, and in 1995 and 2007 this share was reduced to 52 and 3 per cent respectively. Almost 50 per cent of the lead emissions in 2007 were process emissions from manufacturing industries, most of which was from the production of iron, steel and ferroalloys. Other important sources are brake wear and use of leaded petrol in light aircraft, which together caused one third of the emissions in 2007.
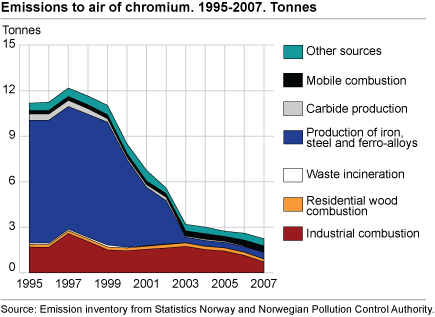
Chromium
The decrease in emissions of chromium was principally due to a 95 per cent reduction in process emissions from the production of iron, steel and ferroalloys. This was mainly due to production alterations at one plant. These emissions represented 72 per cent of the total emissions in 1995, compared to 18 per cent in 2007. However, metal production is still one of the most important sources for chromium emissions to air; only combustion in the wood pulp industry had a larger share in 2007, with 19 per cent of the total emissions.
Arsenic
Arsenic emissions to air increased considerably from 2006 to 2007. However, this does not really represent a trend, but is rather a casual increase caused by annual variations in the arsenic content in raw materials and reducing agents utilised in metal production. The introduction of cleansing measures has, together with reduced activity, caused a lower level on arsenic emissions from metal production, and the emissions in 2007 were only half of the emissions in 1995.
Mercury
During recent years, there have been small annual variations in emissions of mercury, but from 2000 the level has been comparatively stable. In the1990s, the emissions were at a somewhat higher level. Among other things, reduced emissions from waste combustion and cleansing of mercury in the manufacturing industries have contributed to the decrease. The major emission source is the production of iron, steel and ferroalloys, which contributed to 27 per cent of the total emissions in 2007.
Cadmium
The main cause of the decrease in emissions to air of cadmium is reduced process emissions from the production of iron, steel and ferroalloys, due to the introduction of emission-reducing measures and the shutdown of some plants. These emissions were reduced by 66 per cent from 1995 to 2007, and while this industry was the largest emission source in 1995 (24 per cent), it was (with 15 per cent of the total) surpassed in 2007 by both combustion of fuel wood in private households and combustion of wood waste and black liquor in the wood pulp industry, which both contributed to 21 per cent of the total emissions.
Copper
Contrary to the other heavy metals included in the emission statistics, emissions of copper show an increasing trend. The emission growth is mainly due to higher emissions from brake blocks because of traffic growth. These emissions rose by 41 per cent from 1995 and amounted to 46 per cent of the total emissions in 2007. Combustion emissions from road traffic and process emissions from metal production are other important sources, and were responsible for 25 and 10 per cent of the total emissions respectively in 2007.
![Emissions to air of lead. 1995-2007. Tonnes]](/a/en/static/milgiftn_en/fig-2009-02-09-02-en.gif)
Dioxin emissions significantly reduced
A large part of the reduction in dioxin emissions is due to the shutting down of a plant and a mine, which both caused significant emissions. In addition, emissions from waste combustion were reduced by 98 per cent from 1990 to 2007, due to the introduction of cleansing measures. The most important emission source in 2007 was combustion of fuel wood in private households, which caused 29 per cent of the total emissions, whereas process emissions from metal production and combustion emissions from ships and boats were each responsible for 20 per cent.
Uncertainty in the figures
All emission figures are subject to a certain degree of uncertainty. However, due to the measuring uncertainty in figures reported from the plants to the Norwegian Pollution Control Authority, the uncertainty is particularly great for hazardous substances.
Other articles published simultaneously
Go to article on emissions of NOx and NMVOC
Documentation of the Norwegian emission inventory
Tables:
The statistics is published with Emissions to air.
Contact
-
Statistics Norway's Information Centre
E-mail: informasjon@ssb.no
tel.: (+47) 21 09 46 42