Content
Published:
This is an archived release.
Reduced emissions of hazardous substances
In accordance with national targets and international obligations, Norwegian emissions to air of hazardous substances have been reduced considerably since 1995.
The figures presented here have been calculated by Statistics Norway in collaboration with the Norwegian Pollution Control Authority (SFT). In connection with electronic reporting to the SFT there have been some technical problems which has made it impossible to use figures reported to the SFT from licensed plants in 2006. Because the emissions from these plants represent a substantial part of the total emissions of heavy metals, Statistics Norway is unable to publish figures for the year 2006. Preliminary emissions of particulate are estimated for 2006.

The decline since 1995 is mainly due to reduced emissions in the manufacturing industries, caused by improved treatment systems and manufacturing processes and also lower activity in some industries. In addition, emissions of lead from road traffic have been dramatically reduced in the period 1990 to 1997 due to the phasing out of leaded petrol. In the last years, road traffic and use of fuelwood have made up a greater share of the total. This results in less variation from one year to the next.
National and international obligationsReport No. 14 (2006-2007) to the Storting presents new national targets on reductions in emissions of hazardous substances by 2010 from 1995 level. The report lists 25 substances/groups of substances of which emissions shall be eliminated or substantially reduced (50-90 per cent reduction). These reductions comprise emissions to air, water and earth, but the targets are not specified on each category. The figures presented in this article include only emissions to air. In different international agreements, Norway has committed to reduce its emissions to air of certain hazardous substances from 1990 level. Different protocols under the Convention on Long-Range Transboundary Air Pollution (CLRTAP) set out the targets for emissions with regional effects. One of these protocols, the Aarhus Protocol, gives commitments for reduction of PAH and dioxins, lead, cadmium and mercury. For copper, chromium and arsenic, there are no commitments, but requirements for reporting of emissions. |
Lead emissions reduced by more than 24 per cent from 2004 to 2005
In 2005, emissions of lead to air were 68 per cent lower than in 1995 and 96 per cent lower than in 1990. The emissions have decreased from 187 tonnes in 1990, 23 tonnes in 1995 and around 8-9 tonnes per year in the last five years. This is mainly a result of the changeover to unleaded petrol.
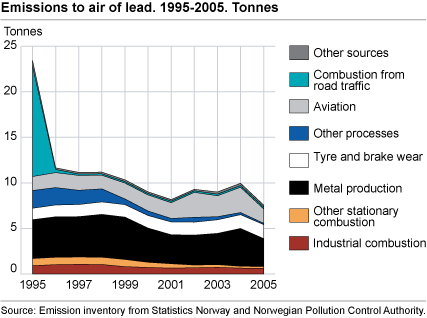
Metal production (iron, steel and ferroalloys) is the main source of lead emissions to air. Leaded petrol is still used in small aircrafts and this is the second most important source. Lower emissions from metal production and less use of leaded petrol are the main reasons for the reduction in emissions from 2004 to 2005. There has been a small increase in emissions from tyre and break wear and exhaust from road traffic from 2004 to 2005. Emissions from tyre and break wear contributed to almost 20 per cent of total lead emission in 2005.
This year’s calculations of lead emissions are about 1 700 kilos higher for all years than last year’s calculations. This is due to improved reporting from one plant. Read more about recalculations later in this article.
Emissions of chromium and arsenic halved since 1995
In addition to a large reduction in emissions of lead, emissions of chromium and arsenic have been reduced by 50 per cent or more since 1995.
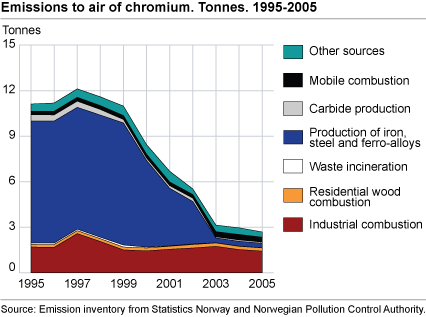
Almost 3 tonnes chromium was emitted in 2005, which is 9 per cent less than in 2004. Almost one third of the emissions stemmed from combustion in pulp and paper manufacturing plants. Since 1995, the emissions have been reduced by 76 per cent, and emissions from iron, steel and ferroalloy production have been reduced by 97 per cent in the same period. Until 2000, emissions form iron, steel and ferroalloy production contributed to almost 70 per cent of the emissions of chromium to air.
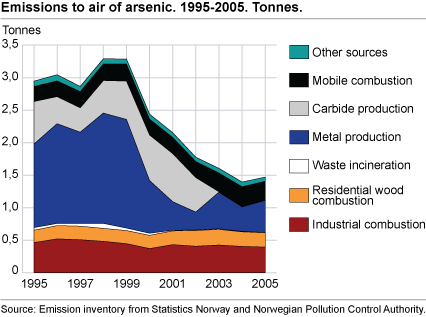
1.5 tonnes of arsenic was emitted in 2005, which is 5 per cent more than in the preceding year. The increase is due to varying arsenic content in raw material and reduction agents used in metal production. The arsenic emissions have been halved since 1995.
For the other heavy metals, mercury and cadmium, there has been a decrease in emission of 21 and 45 per cent respectively since 1995. Emission of cupper has increased by 9 per cent in the same period.
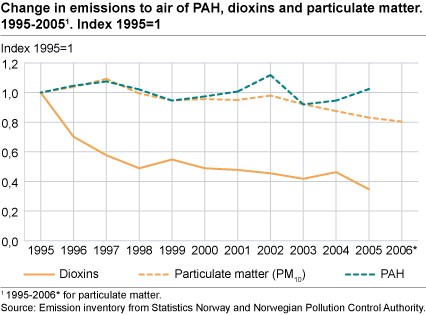
Emissions of PAH is at the same level in 2005 as in 1995 and emissions of dioxin have decreased by 65 per cent.
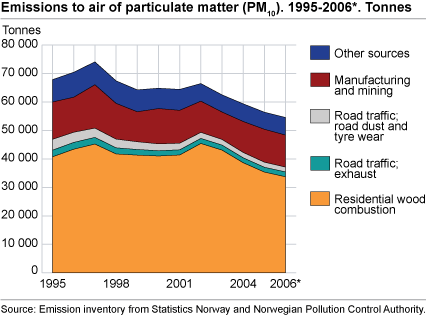
Lower emissions of particulate matter
In 2006, emissions of particulate matter (PM10) to air were 54 600 tonnes. This is 3 per cent lower than in 2005. Nearly two thirds, or 33 700 tonnes, originated from fuelwood use. The manufacturing industries and mining accounted for 20 per cent of the emissions in 2006. Emissions of particulate matter have been reduced by 20 per cent since 1995.
Emissions of particulate matter from fuelwood useA survey carried out by Statistics Norway shows that one of the reasons for the large amount of emissions from fuelwood use is that 59 per cent of the wood is burned in old wood-burning stoves produced before 1998. These stoves are estimated to emit 5-6 times as much particulate matter as new stoves. 38 per cent of the wood is burned in new stoves, which is a 20 percentage point increase from 2002. More information is available here (in Norwegian only). |
Local emissions to airParticulate matter (PM10) and nitrogen oxides (NOX) are the main pollutants that affect local air quality in many places in Norway. Fuelwood use, exhaust from road traffic and road dust are the most important sources. Emissions and local air quality There are important differences between emissions to air and local air quality. The figures presented here cover emissions to air, i.e. the amount of particulate matter that comes out of the chimney or the exhaust pipe. Different emission sources contribute to the concentration of harmful substances in the air. The concentration of the gas/particulate matter is important in determining whether it is dangerous to inhale the gas/particulate matter. By calculating the concentrations, one must take into account that the emissions from fuelwood use are emitted from high chimneys, while exhaust from cars and road dust are emitted near the ground. Emissions from the use of fuelwood will be more diluted than road dust before people inhale it. Therefore, a tonne of particulate matter from fuelwood use may be less important for the ground level concentration than a tonne of exhaust and road dust. |
Uncertainties
The emission data are calculated by Statistics Norway in cooperation with the Norwegian Pollution Control Authority. They are based on measurements from large industrial plants and combustion plants, combined with calculations based on activity data and emission factors. There is uncertainty with the statistics for heavy metals and persistent organic pollutants, mainly due to variations in reported emission data. These sometimes vary considerably from year to year, although the actual emissions may be at the same level. Thus an evaluation of whether it is reasonable to use the reported figures or not, is necessary.
Recalculations
According to guidelines for reporting emission data, the Norwegian emission inventory is recalculated every year for every year back to 1990, in order to report as consistent time series as possible. New knowledge about emission factors, activity data, new emission sources or improved calculation methods are then taken into account.
Documentation of the Norwegian emission inventory
Every year, Statistics Norway publishes a new documentation report on the Norwegian emission inventory. The report describes the calculation methods, documents the activity data, emission factors and the data sources used in the calculations. Quality controls and uncertainty calculations are also described in the report. The report is used as a basis in Norway’s annual emission reports to the United Nation Framework Convention on Climate Change (UNFCCC). The most recent edition of the report is available here .
On State of the Environment Norway you can read about health and environmental effects of heavy metals.
Other articles published today
Lower GHG emissions in 2005 and 2006
Tables:
The statistics is published with Emissions to air.
Contact
-
Statistics Norway's Information Centre
E-mail: informasjon@ssb.no
tel.: (+47) 21 09 46 42