Indicators for sustainable development, 2006
Future challenges for Norway
Published:
The Norwegian set of indicators of sustainable development shows that if current trends continue, Norway will face particular challenges related to greenhouse gas emissions, public sector finances and exclusion from the labour market. Norway makes little contribution to global income equalisation through increased trade with the least developed countries.
The indicators also show the importance of managing human resources satisfactorily in order to maintain national welfare. The labour force and its expertise will be the two most important sources of income in future.
In December 2003, the Norwegian Government appointed an expert committee that was given the task of developing a set of indicators of sustainable development for Norway. The original set consisted of 16 indicators. The main purpose of the indicators is to provide information that can be used in evaluating and implementing the Government’s action plan for sustainable development, its National Agenda 21. The indicator set focuses on the most important economic, environmental and social issues and the links between them. In 2005, the Ministry of Finance (the body responsible for coordinating the sustainable development effort in Norway) conducted a public consultation on the indicator set, and as a result a revised set of indicators was presented in the 2006 National Budget. There were relatively few changes: two new indicators were proposed and one of the original indicators was replaced by another, so that the set now consists of 18 indicators. At the same time, the Ministry pointed to the need for further development and improvement of the indicators, and particularly of the underlying data for some of them.
Climate change
|
Indicator 1: Norwegian emissions of greenhouse gases compared with the Kyoto target |
Concentrations of greenhouse gases in the atmosphere are rising as a result of human activity. The most important reason for this is emissions of carbon dioxide (CO 2 ) from combustion of fossil fuels, which have already resulted in the highest CO 2 concentrations in the atmosphere for at least 650 000 years (Brook 2005), maybe for several million years. As concentrations of greenhouse gases rise, the atmosphere retains more of the thermal radiation from the earth, which causes the global mean temperature to rise and result in climate change. This phenomenon is called the anthropogenic greenhouse effect.
The report Impacts of a Warming Arctic (ACIA 2004) drew attention to the fact that in the past few decades, the temperature increase in the Arctic has been nearly twice as fast as in the rest of the world. Climate change will have far-reaching effects on the environment, resources, society and economy. Not all the effects will be negative, but dealing with them may nevertheless pose major challenges.
Seen on a global scale, 1998 was the warmest year registered since records began in 1850, while 2005 was the next warmest with an average temperature 0.46°C above normal. The annual mean temperature in Norway in 2005 was 1.5°C above average, making it the sixth warmest year since the Norwegian Meteorological Institute started measurements in 1867. The warmest year recorded in Norway is 1990, with an average temperature 1.8°C above normal (Norwegian Meteorological Institute 2006).
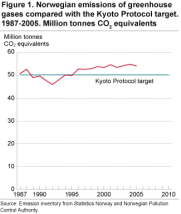
In 2005, Norwegian greenhouse gas emissions decreased by 700 000 tonnes, or 1 per cent. Nevertheless, the overall rise since 1990, the base year for the Kyoto Protocol, is 9 per cent (4.5 million tonnes CO 2 equivalents).
There were several reasons why emissions decreased in 2005, but two in particular stand out. Firstly , the consumption of fuel oils and heating kerosene was considerably lower than the year before. Sales of fuel oils dropped by 25 per cent in 2005. This was probably because many users in the manufacturing industries, households and other sectors switched from oil to electricity for heating purposes in response to higher oil prices. The preliminary energy balance for Norway shows that electricity consumption rose by 2 per cent in 2005 and reached the highest level ever recorded.
Secondly , there was a drop in emissions from industrial processes. This was mainly because of lower production in several branches of industry that generate large greenhouse gas emissions. In addition, a parts of the process industry have introduced measures to reduce emissions that have had an effect over the past 10 years, and from 2004 to 2005. Although there has been an overall reduction in emissions from industrial processes, both production and emissions have increased in certain industries. The preliminary figures indicate for example that aggregate greenhouse gas emissions from aluminium production rose in 2005, but that emissions per unit produced were reduced.
Although greenhouse gas emissions from certain sources decreased somewhat in 2005, there is no evidence that this is the beginning of a downward trend. Emissions from road traffic have risen almost every year since 1990, and the increase is expected to continue. Emissions from the oil and gas industry are also expected to rise considerably in the years ahead, since gas production has not yet reached its peak. In fact, in Facts 2006 - The Norwegian petroleum sector , published in April 2006, the Norwegian Petroleum Directorate and the Ministry of Petroleum and Energy predict a marked rise in CO 2 emissions from the petroleum sector in 2006.
As of 18 April 2006, 163 countries had ratified the Kyoto Protocol. Of these, 36 industrialised countries including Norway have an assigned amount of emissions for the period 2008-2012. If their emissions exceed their assigned amounts, they must make use of the Kyoto mechanisms, which include emissions trading with other industrialised countries and financing approved projects to reduce emissions in developing countries (this is called the Clean Development Mechanism, CDM).
In 2006, Norway is required to submit its initial report under the Kyoto Protocol. The report will provide the final figures for calculating Norway’s assigned amount for the commitment period 2008-2012, based on the emission inventory compiled by Statistics Norway and the Norwegian Pollution Control Authority. The assigned amounts are to be calculated using emission figures for 1990 as a basis, and Norway’s aggregate greenhouse gas emissions in 1990 were 49.8 million tonnes CO 2 equivalents. This means that Norway’s emissions for the whole commitment period must be limited to 251.5 million tonnes CO 2 equivalents (49.8 million tonnes * 1.01 * 5), and Norway can comply with this either by reducing its own emissions or by making use of the Kyoto mechanisms.
Norway has established a national emissions trading system. The Act relating to greenhouse gas emission allowance trading and the duty to surrender emission allowances (Greenhouse Gas Emission Trading Act) entered into force on 1 January 2005. According to the Norwegian Pollution Control Authority, all the 32 installations to which the scheme applied in 2005 complied with their obligations. Emissions from these installations totalled 5.66 million tonnes CO 2 . This was four per cent less than the CO 2 emission allowances allocated to these installations (Norwegian Pollution Control Authority 2006b).
Long-range air pollution: Acidification
|
Indicator 2: Percentage of Norway's land area where critical loads for acidification have been exceeded |
Acid rain is still a serious environmental problem in Norway, even though reductions in emissions have reduced the extent of acidification. Acid rain is caused by emissions of sulphur and nitrogen compounds to air. These compounds can be transported over long distances, and emissions from other countries in Europe account for about 90 per cent of acid deposition in Norway. The southern half of the country is particularly seriously affected by acid rain, because inputs of acidifying compounds are highest here, soils are thin and the bedrock consists of acidic rock types such as gneiss and granite, so that critical loads for acidification are low. Parts of eastern Finnmark also show the impacts of acid rain.
The Gothenburg Protocol, which entered into force in 2005, sets emission ceilings for four gases, to be achieved by 2010. Three of these, NO X , SO 2 and NH 3 , are acidifying substances. Norway has not succeeded in reducing emissions of nitrogen oxides to any great extent since 1990, and these emissions must be reduced by 60 000 tonnes, or on average 12 000 tonnes per year from 2006 to 2010, to reach the target in the Gothenburg Protocol. Norwegian SO 2 emissions have been more than halved since 1990, but some further reduction is needed to reach the 2010 target. Norway’s ammonia emissions are just below the emission ceiling.
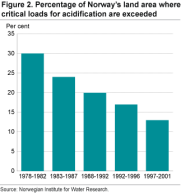
At the beginning of the 1980s, critical loads were exceeded across 30 per cent of the total area of Norway. Since then, the pollution load has been reduced, and in 2000, this figure was down to 13 per cent of the total area of Norway. If all countries meet their commitments under the Gothenburg Protocol, it will drop further to about 7 per cent. Thus, there is still expected to be some fish mortality and damage to fish stocks. However, liming programmes can help fish stocks to become re-established in rivers and lakes where critical loads are exceeded
No newer data are available for this indicator at present.
Inputs of sulphur and nitrogen to Norway have dropped with the emission cuts that have been achieved elsewhere in Europe. In 1980, sulphur deposition in Norway totalled 191 000 tonnes, while in 2003 the figure had dropped to 62 000 tonnes. This is a reduction of just over 65 per cent. Total nitrogen deposition (the sum of oxidised and reduced nitrogen) has dropped from 173 400 tonnes in 1980 to 104 000 tonnes in 2003, which corresponds to a 40 per cent reduction (Norwegian Pollution Control Authority 2006a).
In its annual report for 2004 on monitoring of long-range transport of pollutants, the Norwegian Institute for Air Research (2005) noted that the concentration of sulphur in air has never been lower since measurements started in 1973. According to the 2005 report (Norwegian Institute for Air Research 2006), concentrations of strong acid, sulphate, nitrate and ammonium in precipitation in 2005 were somewhat higher than in 2004, but the same as or lower than in 2003.
The Norwegian Pollution Control Authority’s report summarising the results of all the monitoring programmes for long-range transport of pollutants (Norwegian Pollution Control Authority 2006c) confirms the impression of the past few years that concentrations of acidifying substances are beginning to level off. Although concentrations of these substances in fresh water are lower than they have ever been since the monitoring programmes were started in 1980, there is less improvement from one year to the next than before.
In conclusion, acidification has been considerably reduced, but it should be remembered that this is easier to deal with than a problem such as climate change. It is a relatively straightforward matter to reduce acidifying emissions, for example by introducing equipment to control emissions, but large cuts in greenhouse gas emissions will require much more far-reaching changes.
Biodiversity: Terrestrial ecosystems
|
Indicator 3: Bird population index - Population trends of nesting wild birds |
Trends in bird populations are considered to give a good indication of the state of their habitats. Birds represent different levels in the food chain, they are known to respond to relevant threat factors, and they are widely found in all habitats.
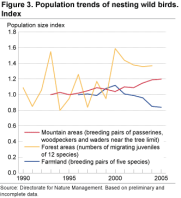
In mountain areas, populations of nesting birds have increased. This trend is expected, given a warmer climate and a denser mountain forest. The figures for forest birds show large variations from year to year and no clear trend. The variations may reflect real fluctuations in populations, but could also be a result of the data collection method. Population trends are also uncertain in agricultural areas.
The three data series shown are all based on incomplete data and are not representative of the country as a whole. This indicator needs further development to obtain better and more representative data. A monitoring system that is intended to provide representative data from the whole country is being developed.
Biodiversity: Fresh-water and coastal ecosystems
|
Indicators 4 and 5: Inland water bodies and coastal waters classified as “clearly not at risk” |
The choice of indicators for aquatic ecosystems is based on recommendations from the Directorate for Nature Management. These indicators are clearly policy-relevant, as they are related to the EU water framework directive. According to the directive, inland water bodies and coastal waters are to be classified by ecological status in five categories: high, good, moderate, poor and bad. Each member country must develop classification methods and monitoring systems.
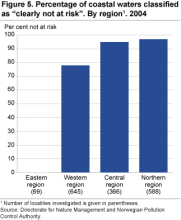
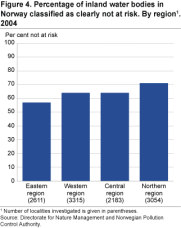
Most inland water bodies and coastal waters in Norway are considered to be “clearly not at risk”. This is particularly clear in the more sparsely populated northern, central and western parts of the country.
The situation is less satisfactory in the eastern part of the country, especially in coastal waters. Here, none of the water bodies have been categorised as “clearly not at risk”. However, these are preliminary results, and a number of the water bodies whose ecological status is uncertain will probably be classified as “good” after further assessment.
New data on the status of water bodies will be available in late autumn 2006.
Cultural heritage
|
Indicator 6: Standards of maintenance of protected buildings |
This indicator is intended to measure how well Norway is looking after its heritage. Data on standards of maintenance of protected buildings are being compiled. As of July 2006, complete data were available for privately-owned protected buildings in the counties of Akershus and Nordland. Surveys of a further 10 counties are to be completed by the end of 2006. From 2007, it will be possible to start reporting on trends in standards of maintenance of protected buildings. The Directorate for Cultural Heritage plans to obtain complete data for the whole of Norway by 2008.
Natural resources: Efficiency in resource use
|
Indicator 7: Energy use per unit GDP |
In a modern society, energy is an essential input factor, and regardless of the energy source used, energy production and use have some kind of impact. Efficient use of energy is therefore particularly important in the context of sustainability.
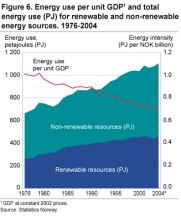
Except for brief periods around 1980 and 1990, value added (measured as GDP) in the Norwegian economy has grown more strongly than domestic energy use, although energy use has also increased substantially. Thus, energy intensity has decreased. International statistics show a similar trend in other OECD countries. A reduction in energy intensity is not necessarily a result of greater energy efficiency in the form of energy savings, since energy efficiency also depends on other factors, including the country’s industrial structure. Structural changes are an important factor behind the observed reduction in energy intensity, together with market conditions, greater productivity and technological progress (Bøeng and Spilde 2006).
From 1976 to 2004, energy use increased by 67 per cent. For the period as a whole, renewable energy use has risen slightly more than non-renewable energy use. However, GDP grew by 139 per cent in the same period, so that energy use has become considerably more efficient relative to value added in this period.
Despite the improvement in energy efficiency, energy use is continuing to rise. Given that a substantial proportion of energy use is based on fossil fuels, this is a problem, particularly in the context of global climate change.
Natural resources: Management of renewable resources
|
Indicator 8: Spawning stock biomass and precautionary (B p a ) reference point for Northeast Arctic cod. |
Fishing has been an important basis for settlement and economic activity throughout Norway's history. Sustainable management of fish resources means that they must not be so heavily exploited that there is a danger of poor recruitment to the stocks. Without sufficient recruitment, there is no basis for long-term, sustainable harvesting of these resources.
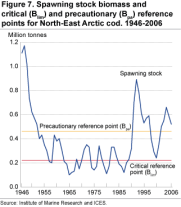
The stock of Northeast Arctic cod is managed jointly by Norway and Russia. The TACs (total allowable catch) are now set according to new rules. Briefly, a three-year horizon has been adopted for the TAC levels, there are rules for how much the TAC can vary in this period, and rules for how the TAC is to be set in relation to spawning stock size and fishing mortality.
The spawning stock of Northeast Arctic cod was about 520 000 tonnes in 2006, which is slightly above the precautionary level. Earlier maturation is an important reason for the rise in spawning stock biomass since 2000.
The critical reference point (B l i m ) for the spawning stock is considered to be a danger level below which there is a high probability of poor recruitment. The level is defined on the basis of historical stock data and current theories on the dynamics of fish stocks. The precautionary reference point (B p a ) is somewhat higher, and can be interpreted as a warning level: if a spawning stock falls below this level, the authorities should consider taking steps to allow the stock to recover to a higher and safer level in order to ensure that the fishery is sustainable.
Although the size of the spawning stock is reasonably satisfactory, fishing mortality (i.e. the proportion of total mortality that is due to fishing) is higher than intended. The Advisory Committee on Fishery Management under ICES has therefore recommended a TAC of 309 000 tonnes for 2007 (162 000 tonnes lower than the TAC adopted for 2006). If this TAC is accepted, the harvesting level will not exceed the precautionary level. According to the ACFM, the TAC calculated using the new management rules is 366 000 tonnes, but given that there is considerable illegal fishing, this level is too high to protect the stock and provide a sustainable yield. Measures to halt illegal and unreported fishing are needed.
It is estimated that unreported catches in 2005 totalled 166 000 tonnes, after remaining at about 100 000 tonnes for several years.
Natural resources: Management of land resources
|
Indicator 9: Irreversible losses of biologically productive areas |
The committee appointed to develop the set of indicators identified productive areas as a critical resource (Official Norwegian Report 2005:5), but found that the data available was insufficient to provide a satisfactory indicator of irreversible losses of biologically productive areas. The 2006 National Budget included a proposal for Statistics Norway and the Norwegian Forest and Landscape Institute to cooperate on the development of this indicator, using studies currently in progress as a basis. However, as of October 2006, the necessary data for this indicator was still not available.
Hazardous substances
|
Indicator 10: Household consumption of hazardous substances |
In recent years, there has been growing awareness of the links between exposure to hazardous substances and injury to human health. Since the discovery in the mid-1960s of the damage that was being caused to bird populations by DDT pollution, research has shown that releases of many chemicals cause environmental damage. From a sustainable development perspective, this knowledge should have clear consequences for the way society responds to the emissions and use of hazardous substances.
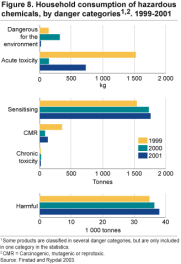
Consumption of products containing carcinogenic, mutagenic and reprotoxic substances dropped by more than 60 per cent from 1999 to 2001. The main reason for this was reduced consumption by the textile industry and the introduction of a tax on perchloroethylene in cleaning products On the other hand, the consumption of products containing sensitising substances rose by 14 per cent in the same period. This was mainly because of a rise in the consumption of paints and varnishes and of cleaning products that are classified as sensitising.
Consumption of products that can have chronic effects or are classified as acutely toxic or as dangerous for the environment is low, and there are few products in these groups.
The largest quantities of hazardous substances that households are exposed to are classified as "Harmful". This group includes products that may cause damage because they contain solvents, substances that are corrosive or irritant, etc. Total consumption of such products in 2001 was 38 000 tonnes, an increase of 9 per cent in the three-year period from 1999.
It was emphasised both by the expert committee that developed the original set of indicators and during the public consultation process that more indicators should be developed for this priority area, especially indicators of levels of environmentally hazardous substances in living organisms and of the impacts on human health and the environment. Statistics Norway, in cooperation with the working environment and environmental authorities, is developing an indicator based on the quantities of hazardous substances sold in the period 2002-2004. Later in 2006, this indicator will be updated using figures for quantities sold in 2005. To increase the relevance of this new indicator, the effect of applying correction factors to the sales figures is being tested. These are intended to provide an estimate of the exposure of people and the environment to different hazardous substances.
Sustainable economy: Sources of income
|
Indicator 11: Net national income per capita, by sources of income |
Norway’s national wealth is an expression of the total value of national resources, and consists of human capital, natural capital, real capital and net foreign assets. Maintenance of Norway’s national wealth is an essential but not a sufficient basis for sustainable development. However, if national wealth is stable and increasing, this is an indication that the country is following a sustainable path of development, whereas the opposite would be an indication that sustainable development is in jeopardy.
Norway’s net national income (NNI) may be regarded as the market-based return on our national wealth. The return on produced assets, net income from abroad and the resource rent from market-priced renewable and non-renewable natural resources are calculated on the basis of figures from the national accounts. Variations in NNI over time may be an indication of changes in national wealth, although more short-term fluctuations in income are often a result of changes in capacity utilisation.
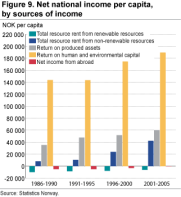
The indicator shows that human capital and environmental capital are of the utmost importance for our economic welfare, and their importance has been increasing since 1986. Human capital should be understood as the entire contribution from the labour force: this includes actual labour provided, i.e. hours actually worked, and the educational level of the workforce, i.e. the quality of the labour provided (Løkkevik and Greaker 2005). Environmental capital includes, in principle, all non-market-based functions of the environment, such as the provision of clean water and air, recipient functions, biodiversity, etc.
The exploitation of non-renewable resources, mainly oil and gas, has become increasingly important since 1985, and is now approaching the return on produced assets.
The resource rent from the primary industries agriculture, forestry and fisheries, has been negative, mainly as a result of subsidies to agriculture. However, the size of the deficit has decreased during the period from the mid 1980s.
Methodology and results of national wealth calculations were documented in Greaker et al. 2005.
Sustainable consumption
|
Indicator 12: Non-petroleum saving |
Are we consuming too much? Or to be more precise: has the Norwegian population consumed more during one year than we had reason to believe could be sustained over time? If the answer is yes, the level of consumption can in a sense be defined as unsustainable. The indicator "Non-petroleum saving" is intended to answer this question, even though several important aspects of consumption are not included. Non-petroleum saving is calculated as Norway’s disposable income minus consumption and the resource rent from petroleum activities, plus the calculated return on the remaining petroleum wealth.
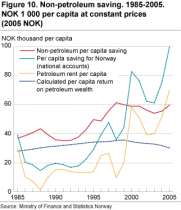
Non-petroleum saving has been positive in the whole period under consideration. In economic terms, consumption in Norway seems therefore to have remained at a sustainable level. Per capita non-petroleum saving is estimated at close to NOK 60 000 in 2005.
Figures for the return on our remaining petroleum wealth are based on expectations and are therefore uncertain. However, it should be noted that saving would have been positive throughout the period even if this return had been disregarded, i.e. if non-petroleum saving had been defined simply as saving minus the resource rent from petroleum activities.
Level of education
|
Indicator 13: Population by highest level of education completed |
The level of education in the population may be regarded as an indicator of the supply of qualified labour for the public and private sectors. The OECD report The Well-being of Nations states that "Education, training and learning can play important roles in providing the basis for economic growth, social cohesion and personal development."
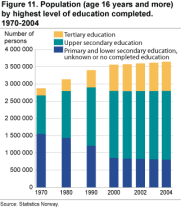
The level of education of the Norwegian population has increased considerably over the last 30 years. In 1970 about 7 per cent of the population had a university-level qualification (tertiary education). By 2004, this had increased to 24 per cent - an increase of 17 percentage points during the last 34 years. During the last 21 years of the period (1983-2004), the number of people with a doctorate has almost quadrupled (from 3 569 to 14 401 persons).
At the other end of the scale, the share of people with only primary and lower secondary education has decreased by over 30 percentage points since 1970.
Today we find the highest level of education among young women. More than 40 per cent of women aged 25-39 years have completed a tertiary education. The corresponding figure for males is a little over 30 per cent.
Sustainable public finances
|
Indicator 14: Generational accounts: Need to reduce public sector finances as a share of GDP |
In Norway, the public sector plays an important role for total welfare, by facilitating economic activity in the private sector, providing basic educational health and social welfare services, and by maintaining an extensive social security system. The expenses for these systems must, over time, be financed within the limits of total public revenues.
The generational accounts are an indicator of whether today's financial policy is sustainable in the long term. For this to be the case, the current value of public sector revenues must correspond to the current value of public sector expenditure.
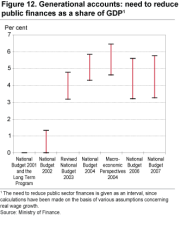
The need to tighten public finances, as estimated in the generational accounts, has increased over time, partly as a result of altered assumptions concerning future developments in life expectancy. In addition, petroleum revenue spending has increased considerably, and expenditure on the national insurance scheme and on health and social services has risen more sharply than other expenditure. The substantial rise in the numbers of elderly people in the years ahead will have an adverse impact on generational balance. On the other hand, the increase in the government’s net cash flow from petroleum activities in the past few years has helped to restore the balance.
The latest estimates in the 2007 National Budget (Report No. 1 (2006-2007) to the Storting) indicate a reduction in the order of NOK 50-90 billion. This is between 3 ½ and 5 ¾ per cent of GDP for Mainland Norway.
It should be noted that the generational accounts are only one indicator or method of analysing the sustainability of public finances. Long-term macroeconomic projections (using the MSG model) of key variables in the Norwegian economy can also be used to illustrate future budgetary challenges.
Global poverty reduction: Development assistance
|
Indicator 15: Norwegian official development assistance as percentage of gross national income |
Norway is one of the world’s richest countries. The quality of life in Norway and the other Nordic countries is higher than almost anywhere else in the world, as reflected by the Human Development Index published by the UN. However, in today’s globalised world, there are strong arguments that the quality of a society should not be judged independently of the contribution it makes to solving global environmental and poverty problems (Barstad 2006).
The effect of development assistance on poverty reduction and economic development is much disputed. The dominant view seems to be that development assistance is effective, but only under certain conditions. It appears to have a poverty-reducing effect in countries with a high level of poverty, but only if a stable economic policy and well-functioning institutions are also in place.
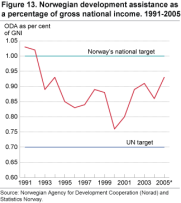
The UN target is for donor countries to provide 0.7 per cent of gross national income (GNI) as official development assistance (ODA). Norway’s national target is to reach 1 per cent of GNI.
In 2005, Norway contributed over 0.9 per cent of GNI as official development assistance. Thus, Norway has not quite achieved its target, but ODA as a proportion of GNI is higher than in most other OECD countries. Norway’s net development assistance rose from NOK 14.8 billion in 2004 to NOK 17.9 billion in 2005. In the same period, GNI rose from NOK 1 724 billion to NOK 1 913 billion.
Global poverty reduction: Trade with least developed countries (LDCs)
|
Indicator 16: Imports from LDCs and other countries in Africa |
If we are to succeed in advancing global sustainable development, the most important tasks will be to resolve environmental problems and reduce poverty. The overriding objective of the UN Millennium Development Goals, adopted in 2000, is the reduction of global poverty. Calculations by the World Bank show that economic growth is vital for poverty reduction. One of the most important means of promoting economic development in developing countries is to give them the opportunity to sell their goods and services to industrialised countries on equal terms with other countries. Other important measures are economic and technical assistance to improve education systems and health services.
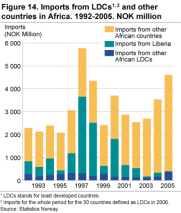
Although total imports to Norway from developing countries rose from 2004 to 2005 (Statistics Norway 2006c), there has been little change in trade with least developed countries (LDCs) as defined by the Norwegian Agency for Development Cooperation (Norad).
Imports from Africa make up only a small percentage of total imports to Norway, accounting for 2 per cent of the total in the mid-1990s. Since then, imports from Africa have fallen to below 1 per cent of total Norwegian imports. Imports from LDCs in Africa other than Liberia have been very modest and fairly stable throughout the period 1992-2005, and accounted for only 0.1 per cent of Norway’s total imports in 2005.
Liberia is classified as an LDC. Norwegian imports from African LDCs have been dominated by imports of second-hand ships from Liberia, which must be seen in the context of Norwegian shipowners' use of the international ship register in Liberia. In 2005, imports from Liberia were very modest, and imports from African LDCs were dominated by the import of crude oil from Equatorial Guinea valued at close to NOK 200 million.
In 2005, Norway’s imports from LDCs totalled NOK 890 million, or 0.2 per cent of its total imports. Of this, NOK 390 million, or 44 per cent, came from LDCs in Africa (34 countries). Imports from LDCs outside Africa (16 countries) are dominated by imports from Bangladesh. In 2005, these totalled NOK 414 million, more than the value of imports from all African LDCs, and 47 per cent of all imports to Norway from LDCs.
Exclusion from the labour market
|
Indicator 17: Long-term unemployed persons and disability pensioners as percentage of population |
For most people, employment is an important basis for their income and a key to social inclusion. Although unemployment is low in Norway by international standards, the proportion of the population who receive a disability pension is high and rising.
If a large proportion of the working age population is outside the labour market, this may be a serious threat to the maintenance of human capital. In the long term, this may affect the productive capacity of the economy and social stability, and thus the sustainability of society.
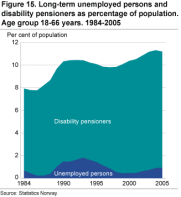
During the economic downturn at the beginning of the 1990s, a relatively high percentage of adults were excluded from the labour market. This applied both to the long-term unemployed and to disability pensioners.
There was a temporary decrease in exclusion from the labour market until 1998, but since then the percentage has increased again and reached 11 per cent of the population in 2005. Most people excluded from the labour market are disability pensioners, and they also accounted for most of the rise in total numbers. In 2005, 27 000 people were registered as long-term unemployed and more than 300 000 as disability pensioners. Far more women (172 000) than men (129 000) were registered as disability pensioners. In contrast, more men (16 000) than women (11 000) are registered as long-term unemployed.
Labour force participation, i.e. the proportion of the population aged between 16 and 74 who are in the labour force, rose by 0.3 percentage points from the first quarter of 2005 to the first quarter of 2006. There was a rise for both women and men, and for all age groups except those below the age of 20.
According to the Labour Force Survey, the number of unemployed people was on average 12 000 lower in the first quarter of 2006 than in the first quarter of 2005. The decrease was greatest for men in the age groups 16-24 and 25-54. Unemployed people accounted for 3.9 per cent of the labour force (4.1 per cent for men and 3.8 per cent for women).
The seasonally-adjusted unemployment rate was 4.0 per cent in February 2006, as compared with 4.5 per cent in November 2005. In the same period, the rate in the EU15 area remained unchanged at 7.7 per cent, and the rate in the OECD countries decreased from 6.5 to 6.3 per cent.
Long-term unemployed people made up 33 per cent of all unemployed in the first quarter of 2006, which is a rise of 9 percentage points from the first quarter of 2005 (Statistics Norway 2006b).
Health and welfare
|
Indicator 18: Life expectancy at birth |
Life expectancy is an indicator that captures a number of factors related to health and social welfare.
Changes in the indicator can indirectly illustrate for example the quality of health services, changes in lifestyle, the quality of people’s lives, diet, alcohol and drug abuse, accidents, etc.
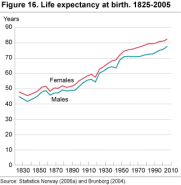
Life expectancy in Norway has been increasing for nearly two hundred years and there is every indication that this trend will continue. In recent years, male life expectancy has been increasing particularly quickly, after levelling off in the 1950s and 1960s. Life expectancy increased by 0.2 years for both sexes from 2004 to 2005, and was the highest ever estimated. Male life expectancy at birth is now 77.7 years, and female life expectancy is 82.5 years. An important cause of this is declining infant and child mortality, but lower mortality in older age groups has also contributed to the increasing life expectancy.
According to new population forecasts, life expectancy at birth will increase by about 8 years from 2004 to 2060, to 86.0 years for men and 90.1 years for women (Keilman and Pham 2005).
Thus, population projections from Statistics Norway indicate that the Norwegian population will continue to age, almost regardless of what assumptions are made. Norway will therefore have a permanently higher share of older people in the population and higher pension and social security expenditure than today. This cannot be avoided by, for example, an increase in fertility or net immigration within realistic limits (Brunborg 2004).
Background and perspectives
In December 2003, the Norwegian Government appointed an expert committee that was given the task of developing a set of indicators of sustainable development for Norway. The main purpose of the indicators is to provide information that can be used in evaluating and implementing the government’s action plan for sustainable development, its National Agenda 21. In its report (Official Norwegian Report 2005:5), the committee proposed a set of 16 indicators.
In 2005, the Ministry of Finance, which is responsible for coordinating the sustainable development effort in Norway, conducted a public consultation on the indicator set, and as a result a revised set of indicators was presented in the 2006 National Budget. There were relatively few changes: two new indicators were proposed and one of the original indicators was replaced by another, so that the set now consists of 18 indicators (table 1). At the same time, the Ministry pointed to the need for further development and improvement of the indicators, and particularly of the underlying data for some of them.
The set of indicators includes state and pressure indicators for several priority areas defined by the Government and indicators of the state of different components of Norway’s national wealth. The policy areas are as follows:
Climate, ozone and long-range air-pollution
Biodiversity and cultural heritage
Natural resources
Hazardous substances
Sustainable economy
Social conditions of direct significance for sustainable development
Table 1 shows the relationship between the set of indicators and the policy areas. It should be noted that some indicators may be important explanatory variables for trends in several policy areas. For example, climate change will have considerable impacts on biodiversity, if the climate change has major impacts, this will have far-reaching consequences for economic and social conditions.
Norway’s national set of indicators for sustainable development
In spring 2006, the Ministry of Finance conducted a public consultation in connection with the development of a new national strategy for sustainable development. The results of this process may in the long run have consequences for the set of indicators.
It is a difficult task to determine whether or not development is sustainable, since sustainability is about what will or may happen in the long term , and involves environmental, economic and social issues. Norway has chosen to take the “capital approach” to the development of the indicator set. The reason for this is that our welfare today and in the future may be considered as the return on our total national wealth . This wealth consists of fixed assets such as machinery, tools and buildings, natural resources such as oil, gas, fish, forests and soil, environmental goods such as clean air and water, and last but not least, the labour force, knowledge and expertise that constitute human capital . If we are to succeed in maintaining and preferably improving our welfare in the long term, the national wealth must be conserved or preferably increased. Policies that ensure sound management of the total national wealth are therefore an essential basis for sustainable development.
The national wealth consists of many different components that cannot necessarily be substituted for each other. It is therefore necessary to develop several indicators that can show trends in different components of the national wealth. For example, life expectancy, level of education and exclusion from the labour market are three indicators that illustrate important aspects of the human capital.
A number of serious obstacles to sustainable development are primarily of an international nature. The UN Millennium Development Goals, adopted in 2000, set a number of clear targets including the reduction of global poverty. Norway also has commitments under a number of global and regional environmental agreements. The proposed national indicator set for Norway therefore also includes indicators of Norwegian efforts and pressures exerted by Norway that are related to global challenges.
The indicator set focuses on the most important economic, environmental and social issues and the links between them, so that it can be of direct practical use in policy development.
References
ACIA (2004): Impacts of a Warming Arctic : Arctic Climate Change Impact Assessment . Cambridge University Press, 2004. http://www.acia.uaf.edu/
Barstad, A. (2006): "Verdens beste" også til å redusere global fattigdom .(Is Norway a world leader in global poverty reduction as well?) I: Samfunnsspeilet no. 3/2006, Statistics Norway. http://www.ssb.no/samfunnsspeilet/
Brook, E.J. (2005): Tiny bubbles tell all, Science , vol. 310, p. 1285-1287, 25 Nov. 2005.
Brunborg, H. (2004): Befolkningen blir eldre (The population is ageing). Economic analyses 5/2004, Statistics Norway. http://www.ssb.no/emner/08/05/10/oa/200405/brunborg.pdf
Bøeng, A.C. and D. Spilde (2006): Energiindikatorer 1990-2004. Gir økt verdiskapning mer effektiv energibruk? (Energy indicators 1990-2004. Does an increase in value added give more efficient energy use?) Economic analyses 3/2006, Statistics Norway. http://www.ssb.no/emner/08/05/10/oa/200603/boeng.pdf
Finstad, A. and K. Rypdal (2003): Bruk av helse- og miljøfarlige produkter i husholdningene - et forprosjekt (Use of products containing hazardous chemicals in households). Notater 2003/29, Statistics Norway. http://www.ssb.no/emner/01/04/10/notat_200329/notat_200329.pdf
Greaker, M., P. Løkkevik and M. Aasgaard Walle (2005): Utviklingen i den norske nasjonalformuen fra 1985 til 2004. Et eksempel på bærekraftig utvikling? (Norway's national wealth 1985-2004. An example of sustainable development?) Reports 05/13, Statistics Norway. http://www.ssb.no/emner/09/01/rapp_200513/rapp_200513.pdf
Keilman, N. and Pham, D.Q. (2005): Hvor lenge kommer vi til å leve? Levealder og aldersmønster for dødeligheten i Norge, 1900-2060 (How long will we live for? Life expectancy and patterns of mortality in Norway, 1900-2060), Economic Analyses 6/2005 (p. 43-49). Statistics Norway. http://www.ssb.no/emner/08/05/10/oa/200506/folkfram05.pdf
Løkkevik, P. and M. Greaker (2005): Utviklingen i den norske nasjonalformuen fra 1985 til 2004
Menneskelige ressurser gjør Norge rikt.(The Norwegian national wealth 1985-2004. Human resources make Norway a rich country) Magazine, 26 May 2005, Statistics Norway. http://www.ssb.no/vis/magasinet/analyse/art-2005-05-26-01.html
Norwegian Institute for Air Research (2005): Overvåking av langtransportert forurenset luft og nedbør. Atmosfærisk tilførsel, 2004 (Monitoring of long-range transport of polluted air and precipitation, atmospheric inputs, 2004). Report 929/2005 (TA-2102/2005).
Norwegian Institute for Air Research (2006): Overvåking av langtransportert forurenset luft og nedbør. Atmosfærisk tilførsel, 2005 (Monitoring of long-range transport of polluted air and precipitation, atmospheric inputs, 2005). Report 955/2006 (TA-2180/2006).
Norwegian Meteorological Institute (2006): Været i Norge. Klimatologisk månedsoversikt - året 2005. (The weather in Norway. Monthly climatological overview, 2005) Norwegian Meteorological Institute. http://met.no/observasjoner/maned/2005/2005-aar.html
Norwegian Pollution Control Authority (2006a): http://www.miljostatus.no/ , Norwegian Pollution Control Authority.
Norwegian Pollution Control Authority (2006b): http://www.sft.no/kvoteregister/ , Norwegian Pollution Control Authority. ( http://www.sft.no/english/news/dbafile15082.html )
Norwegian Pollution Control Authority (2006c): Overvåking av langtransporterte forurensninger 2005 - Sammendragsrapport. (Monitoring of long-range transport of pollutants 2005. Summary) TA-2183/2006.
OECD (2001): The Well-being of nations. The role of human and social capital. Centre for Educational Research and Innovation. Paris: Organisation for Economic Co-operation and Development.
Official Norwegian Report (2005:5): Enkle signaler i en kompleks verden . Forslag til et nasjonalt indikatorsett for bærekraftig utvikling . (Simple signals in a complex world. Proposal for a national set of indicators for sustainable development). Statens forvaltningstjeneste, Oslo.
Report No. 1 (2003-2004) to the Storting: Nasjonalbudsjettet 2004 . Kapittel 6: Nasjonal handlingsplan for bærekraftig utvikling (National Budget 2004, Chapter 6: Norway's Action Plan for Sustainable Development). Ministry of Finance. http://odin.dep.no/filarkiv/206402/nat_action.pdf
Report No. 8 (2004-2005) to the Storting: Perspektivmeldingen 2004 - Utfordringer og valgmuligheter for norsk økonomi (Long-term perspectives for the Norwegian economy). Ministry of Finance.
Report No. 1 (2005-2006) to the Storting: Nasjonalbudsjettet 2006 (National Budget 2006). Ministry of Finance.
Report No. 1 (2006-2007) to the Storting: Nasjonalbudsjettet 2007 (National Budget 2007). Ministry of Finance.
Statistics Norway (2006a): Befolkningsstatistikk. Døde, 2005. Levealderen øker fortsatt. (Population statistics. Deaths 2005. Life expectancy still increasing) Dagens statistikk (Today's statistics) 27 April 2006, http://www.ssb.no/english/subjects/02/02/10/dode_en/
Statistics Norway (2006b): Arbeidskraftundersøkelsen, 1. kvartal 2006. 22 000 flere midlertidig ansatte. (Labour Force Survey, 1st quarter 2006. A further 22 000 in temporary employment) Dagens statistikk (Today's statistics) 12 May 2006, http://www.ssb.no/english/subjects/06/01/aku_en/
Contact
-
Statistics Norway's Information Centre