Environmental statistics for Svalbard
Environmental impacts and indicators for the state of the nature on Svalbard
Published:
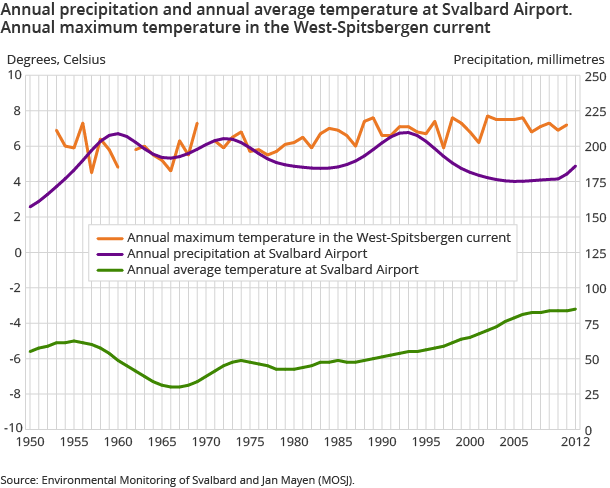
Svalbard covers 61 022 km 2 , about 98 per cent of which is wilderness. The annual average temperature in 2012 was -3.2°C (Svalbard Airport), compared to -7.6°C in 1967 – an indication that the temperature has gradually risen. The glaciers are dwindling. Local emissions of CO 2 are increasing. Long-range transboundary air pollution has declined.
Svalbard consists of all islands and skerries between 74° and 81° north latitude and 10° and 35° east longitude, and the largest is Spitsbergen. Svalbard is surrounded by the Barents Sea, the Greenland Sea and the Arctic Ocean. The archipelago contains the largest continuous wilderness in Norway.
The purpose of the Svalbard Environmental Protection Act is to safeguard the virtually untouched areas in Svalbard. Within the limits of this framework, environmentally sound settlement, research and commercial activity is provided for. Approximately 40 000 km 2 is protected, and around 99.8 per cent is national parks and nature reserves.
On the basis of environmental surveillance programs there are several statistics available on various formats and web portals. The motivation for all of them is to show whether the management is in compliance with the protection act and that the unique wilderness is kept unspoiled. Statistics Norway plays a central role in establishing official statistics for Svalbard and environmental statistics is part of this. It is challenging to delimit the statistics to a set of environmental parameters that in the best way possible reflects the development of the Svalbard nature. In addition, the parameters should have a proper time series with the prospects of continuity.
Long-range environmental impact
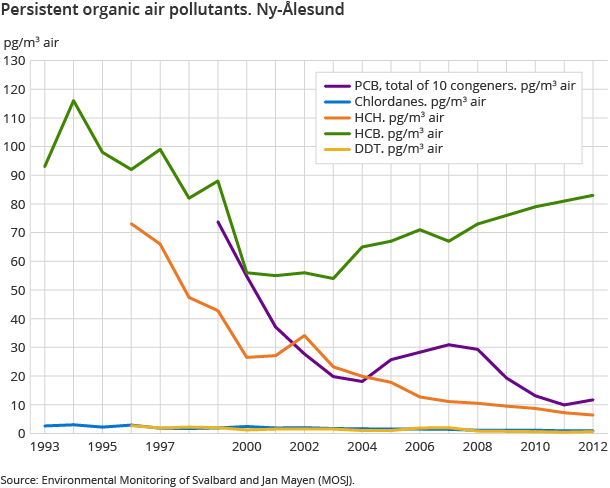
Persistent organic pollutants
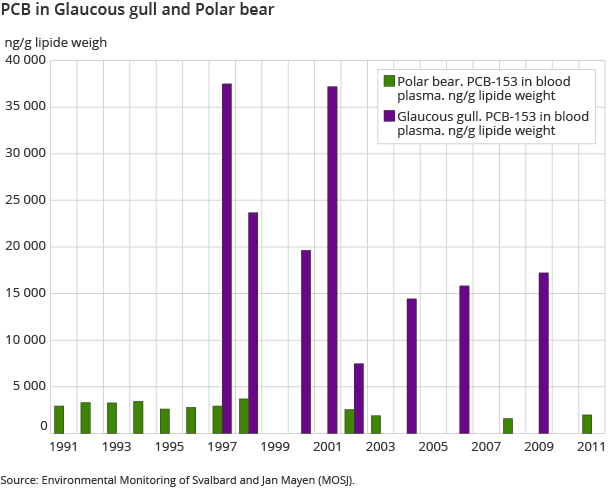
Seemingly, Svalbard is far to the north and a long distance from where major pollution activities take place. Nonetheless, air- and sea-currents carry pollutants to the Svalbard archipelago and the surrounding oceans. Several persistent organic pollutants are easily absorbed in adipose tissue in organisms and these compounds accumulate in the food chain. This is very common for the long marine food chains of the Arctic. For some species the levels of persistent organic pollutants in adipose tissue have become so high that immune systems and hormone systems are damaged. This can lead to shortened lifespan and reduced fertility. On Svalbard, during the last 10 – 15 years, monitoring shows a decrease in concentrations for several airborne pollutants, but not for all.
Local environmental impacts
Emissions to air
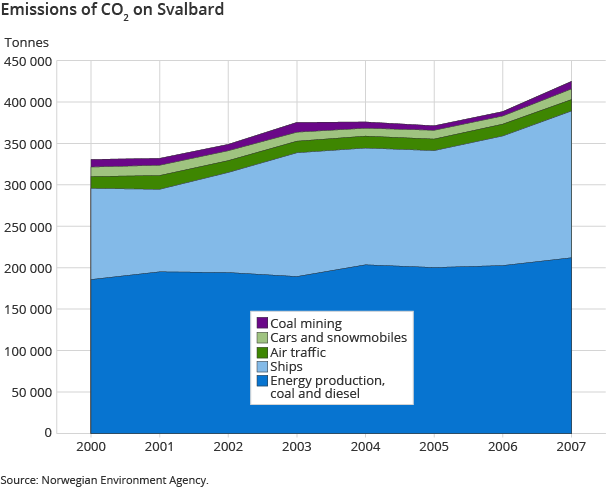
The settlements are the main local sources of pollution. The pollution comprises emissions to air, water and ground, and the activities that cause most of the pollution are coal fired power stations, diesel generators and transportation (airplane, helicopter, boat, cars and snow mobile). A survey carried out in 2009 for the Norwegian Environment Agency, shows that for the years 2000 – 2007, the CO 2 -emissions are increasing. Boat traffic is the main contributor to the growing CO 2 -emissions.
Discharges to water
Discharges to water bodies (freshwater and sea) on Svalbard are mainly from the untreated sewerage system and from an unknown amount of diffuse pollution. The estimated annual discharge of phosphorus from Longyearbyen (population 2 100) is 1.2 tonnes. The discharge of nitrogen is estimated to 9 tonnes per year.
Waste
The settlements produce waste. The statistics for 2011 on waste from households in Longyearbyen show that on average each inhabitant discards 216 kg per year. That is less than half of what inhabitants on the mainland dispose of per year. In Longyearbyen all dwellings have quite recently installed waste disposers for food waste that are connected to the sewerage system. This contributes to the quite low figures on household waste but increases the load of organic material that is discharged to the fjord.
During the last couple of years somewhere between 100 and 300 tonnes of hazardous waste have been collected annually. In 2012 160 tonnes were collected and sent to the mainland for treatment.
Transportation
The statistics on local emissions reveals considerable contributions from traffic; ships, aircrafts and other types of vehicles. Since 2000, there have been on average 6 400 aircraft movements on Svalbard Airport every year. Around 1 300 movements are incoming or outbound flights. The remaining 4 100 are flights to and from destinations on the archipelago.
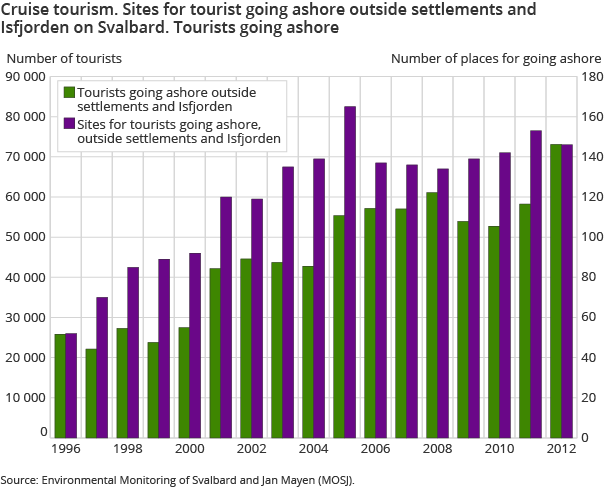
Most of the ships are involved in tourism. Regular cruise ships are dominating, but there are also smaller boats taking tourists on day trips to various destinations. Every year around 40 000 guests arrive in Longyearbyen. A considerable part of these guests also go on boat trips. A major part of the boat trip experience is to go ashore on sites of historical significance or for nature experiences. In 2012 circa 121 000 persons went ashore on 239 different sites. Many persons went ashore on several sites on their trips.
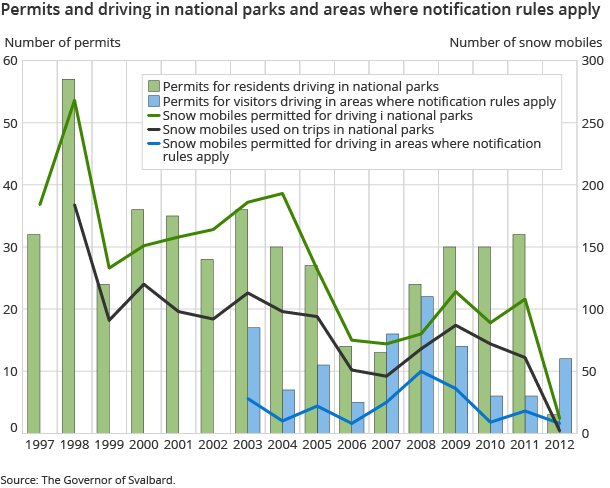
Another highly appreciated activity on Svalbard, for both residents and tourists, is snowmobile driving. There are slightly above 2 000 registered snowmobiles on Svalbard. The annual number of trips is partly determined by the weather and snow conditions, but also by the number of tourists wanting to go on a trip. In 2012 the snow conditions were very difficult and the number of trips accordingly low.
There is a falling trend in the driving of snowmobiles in areas where notification rules apply. The number of residents that apply for permits for driving in national parks has dropped and so has the number of completed trips. The same trend can be seen for tourists driving in areas where notification rules apply.
Guided trips on snowmobiles are still popular, and depending on the snow conditions, the number of days in the field for guided trips varies between 2 500 and 4 500 per year.
Hunting
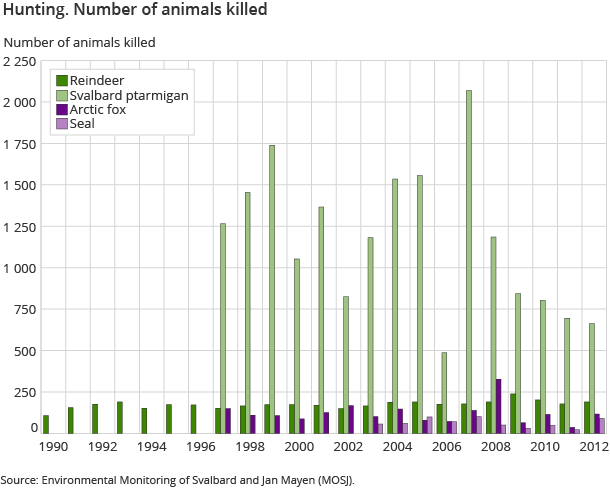
Since 1997 there has been an annual average kill of 1 170 Svalbard ptarmigan, 180 reindeer, 122 arctic fox and 63 seals. Walrus and polar bear are protected, so there is no hunting season on these two species. Still, since 1990 there has been shot 2.6 polar bears per year, predominantly of safety reasons.
State of nature
Climate
An important precondition for the species that inhabit Svalbard to remain is a stable climate. Since the middle of the 1960-ies, the annual average temperature at Svalbard Airport has increased by 4.4 °C. The maximum temperature in the West-Spitsbergen current shows a similar upward trend.
Glaciers
Glaciers are influenced by climate. The gap between winter accumulation and melting in the summer expresses the change in mass balance for a glacier. Melting of glaciers on a large scale can lead to a rise in sea level. Glaciers also influence on microclimate and the conditions for local plants an wildlife.
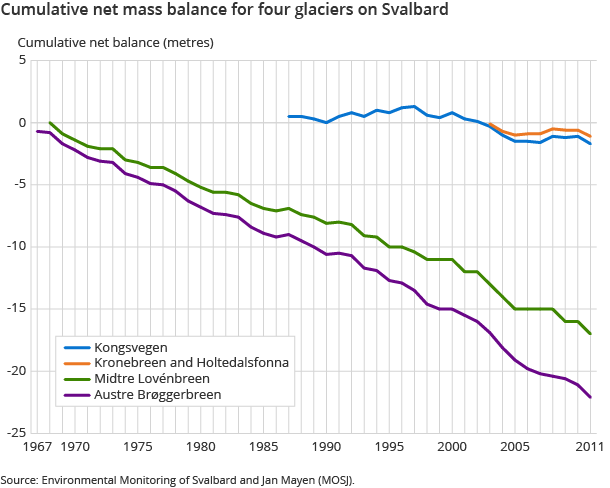
The monitoring of the glaciers Austre Brøggerbreen, Midtre Lovénbreen, Kronebreen and Holtedalsfonna and also Kongsvegen has revealed a loss of ice mass. For Kongsvegen, since it is located higher than the other glaciers and has a larger accumulation area, the mass balance has been positive for several years throughout the monitoring period. However, the net balance has gradually shifted from positive to negative and Kongsvegen now seems to be in a long-term decline.
Sea ice
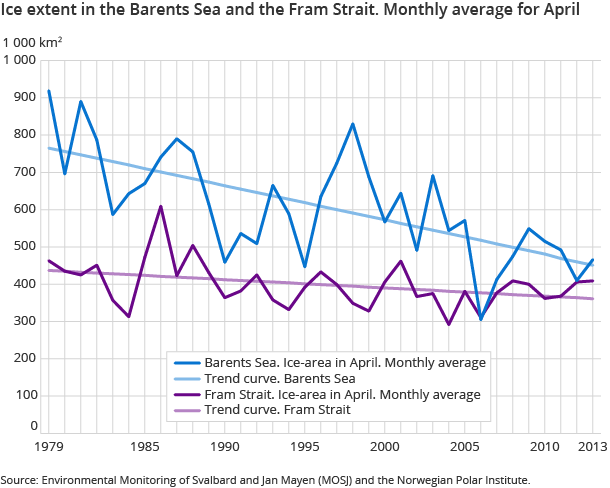
One of the most important preconditions for the entire arctic ecosystem, and the areas around Svalbard, is the sea ice. Enormous amounts of phytoplankton are produced along the ice shelf and give the basis for a complex food chain. The sea ice is also habitat for seal and polar bear. In April the sea ice is normally at its largest extent. Normally there are annual variations, but since the beginning of monitoring the sea ice there has been a falling trend for the ice extent. This can be seen for both the Barents Sea and the Fram Strait.
Indicator species
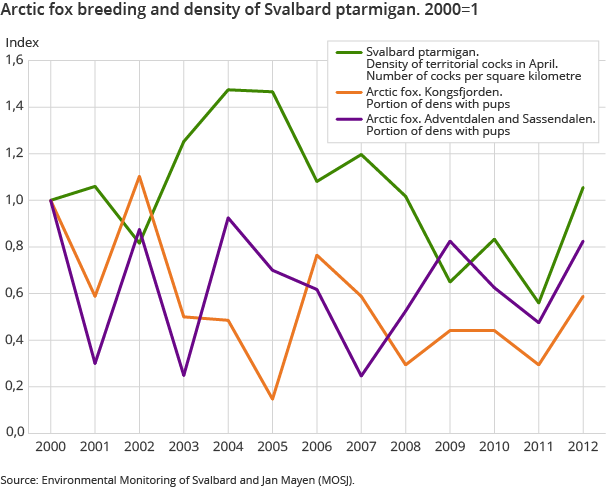
On both land and sea Svalbard boasts a rich plant- and wildlife. A selection of indicator species can give valuable information on status for the food chains. The huge variations in arctic fox breeding scientist assume are related to food supply. Available reindeer carcases in the winter and the vicinity of the den to seabird colonies are decisive for the number of arctic fox dens with cubs. The number of arctic foxes is quite stable even though there are variations in breeding activity. In addition, there seems to be a correlation, to some extent, between arctic fox breeding and the density of Svalbard ptarmigan.
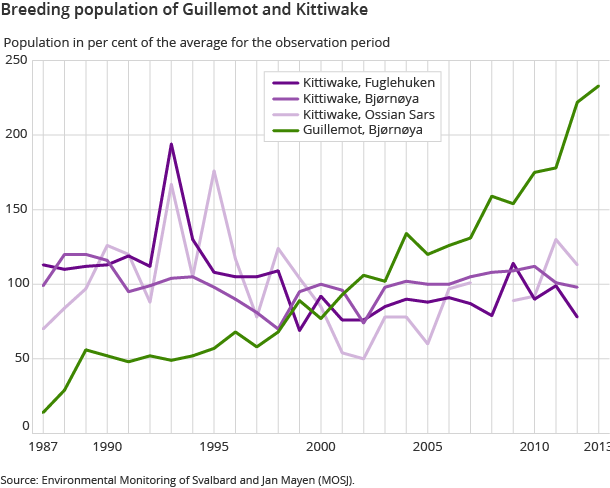
In the breeding season Guillemot feed on fish species like capelin and herring. This makes Guillemot a good indicator on variations in fish populations. The Guillemot population in the Barents Sea and northern parts of the Norwegian Sea has dropped dramatically, and this bird is now on the Norwegian “red list” of threatened species. During the winter of 1986 – 1987 the Guillemot population on the island Bjørnøya collapsed due to lack of capelin to feed on. Since then the population has been increasing and Bjørnøya now has the largest breeding population in the Barents Sea.
In contrast to the Guillemot, Kittiwake feeds on organisms on or close to the sea surface. The Kittiwake feeds on shoals of young capelin, cod and crustaceans, and represents this part of the marine ecosystem. The Kittiwake population is now stable after a period of recession.
Tables
- Table 1. Persistent organic air pollutants. Ny-Ålesund. 1993 - 2012
- Table 2. PCB in Glaucous gull and Polar bear
- Table 3. Emissions of CO2 on Svalbard. Tonnes. 2000 - 2007
- Table 4. Cruise tourism. Sites for tourist going ashore outside settlements and Isfjorden on Svalbard. Tourists going ashore. 1996 - 2012
- Table 5. Permits and driving in national parks and areas where notification rules apply. 1997 - 2012
- Table 6. Hunting. Number of animals killed. 1990 - 2012
- Table 7. Annual precipitation and annual average temperature at Svalbard Airport. Annual maximum temperature in the West-Spitsbergen current. 1950 - 2012
- Table 8. Cumulative net mass balance for 4 glaciers on Svalbard. Metres. 1967 - 2011
- Table 9. Ice extent in the Barents Sea and Fram Strait. Monthly average for April. 1 000 km. 1979 - 2013
- Table 10. Arctic fox breeding and density of svalbard ptarmigan. 2000 - 2012. Index (2000 = 1)
- Table 11. Breeding population of Guillemot and Kittiwake in 4 locations. Population in per cent of the average for the observation period. 1987 - 2013
- Table 12. Number of days in the field on organised snow mobile trips. Management areas. Years
- Table 13. Flights to and from Svalbard Airport. Years
Contact
-
Jørn Kristian Undelstvedt
-
Jan Henrik Wang
-
Statistics Norway's Information Centre

