Content
Published:
This is an archived release.
Health accounts for 9 per cent of GDP
Total health expenditure amounted to NOK 203 billion in 2007. Public financing accounted for 84 per cent, which is above the OECD average. Total health expenditure as a share of gross domestic product was 9 per cent in 2007.
The GDP ratio varied between 8.4 and 10 per cent during the last decade. The share varies considerably between the OECD countries . The OECD average was 9 per cent in 2005.
Total expenditure on health doubled from 1997 to 2007. In real terms, the average annual growth rate was slightly above 3 per cent. The annual growth was higher in the first part of the period, and showed significant variations between the different types of services.
| 1997 | 1998 | 1999 | 2000 | 2001 | 2002 | 2003 | 2004 | 2005 | 2006* | 2007* | |||||||||||||||||||||||||||||
|---|---|---|---|---|---|---|---|---|---|---|---|---|---|---|---|---|---|---|---|---|---|---|---|---|---|---|---|---|---|---|---|---|---|---|---|---|---|---|---|
| Total expenditure on health. NOK million | 94 008 | 105 500 | 115 711 | 124 728 | 135 266 | 150 029 | 159 572 | 168 237 | 176 984 | 187 595 | 203 414 | ||||||||||||||||||||||||||||
| HC R.1 Capital formation of health care provider institutions. NOK million | 5 635 | 7 480 | 8 945 | 8 496 | 9 778 | 9 528 | 10 262 | 10 956 | 11 163 | 11 910 | 12 861 | ||||||||||||||||||||||||||||
| Total current expenditure on health.NOK million | 88 373 | 98 021 | 106 766 | 116 232 | 125 488 | 140 501 | 149 310 | 157 281 | 165 820 | 175 685 | 190 553 | ||||||||||||||||||||||||||||
| Total expenditure on healt in current prices in per cent of GDP | 8.4 | 9.3 | 9.3 | 8.4 | 8.8 | 9.8 | 10.0 | 9.7 | 9.1 | 8.7 | 8.9 | ||||||||||||||||||||||||||||
| Total expenditure on health in current prices in per cent of GDP Mainland Norway | 10.2 | 10.6 | 11.1 | 11.2 | 11.5 | 12.3 | 12.5 | 12.4 | 12.2 | 11.9 | 11.9 | ||||||||||||||||||||||||||||
| Total expenditure on healt in current prices per capita | 21 340 | 23 807 | 25 933 | 27 773 | 29 968 | 33 059 | 34 957 | 36 638 | 38 281 | 40 251 | 43 196 | ||||||||||||||||||||||||||||
| Total expenditure on health at constant NOK in 2000 per capita | 24 606 | 25 781 | 27 233 | 27 773 | 28 564 | 30 694 | 31 345 | 32 036 | 32 540 | 32 960 | 33 537 | ||||||||||||||||||||||||||||
Health expenditure - increasing share of total general government expenditure
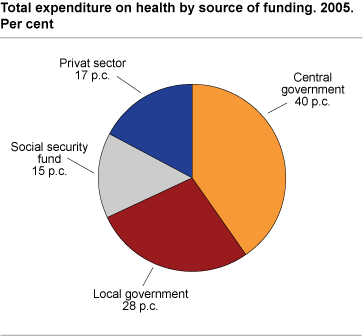
Health care in Norway is mainly publicly financed. Since 2001, public financing has accounted for about 84 per cent of total health expenditure. This is on level with other Nordic countries, but lower than in Luxembourg, the Czech Republic and United Kingdom which had the highest share of public spending of the OECD countries, with a public share of 91, 89 and 87 per cent respectively in 2005. On average, the public share of health spending was 73 per cent in the OECD countries in 2005. In contrast, the public share of health financing in the United States, ranking highest in terms of GDP ratio and per capita spending, was 45 per cent.
Public spending on health accounts for an increasing share of total general government expenditure, from 15.8 per cent in 1997 to 19.5 per cent in 2007. About two thirds of the public funding is channelled through general government and the social security fund. In recent years, some of the responsibilities of the social security fund have been transferred to central government. The main component of the central government health expenditure is related to hospital services, whereas local government health spending is mainly allocated to long term nursing care (LTC).
Minor variations in allocation of health spending
The composition of total health expenditure has barely changed between 1997 and 2007. Throughout the entire period, the largest share of health expenditure was allocated to hospital services and long-term nursing care. As shown in the table, expenditure on in-patient curative care accounted for a decreasing share, whereas expenditure on day cases has increased. With regard to long-term nursing care, sum HC3.1 and HC3.3, the expenditure has increased from 22. per cent to 26. per cent since 1997, which is the highest share in the OECD.
| 1997 | 2002 | 2007 | |||||||||||||||||||||||||||||||||||||
|---|---|---|---|---|---|---|---|---|---|---|---|---|---|---|---|---|---|---|---|---|---|---|---|---|---|---|---|---|---|---|---|---|---|---|---|---|---|---|---|
| HC 1.1 In-patient curative care | 28.6 | 26.8 | 26.4 | ||||||||||||||||||||||||||||||||||||
| HC 1.2 Day cases of curative care | 2.4 | 3.6 | 3.8 | ||||||||||||||||||||||||||||||||||||
| HC 1.3-1.4 Out-patient curative care | 21.4 | 19.1 | 19.8 | ||||||||||||||||||||||||||||||||||||
| HC 2.1 Services of rehabilitative care | 1.6 | 1.5 | 1.5 | ||||||||||||||||||||||||||||||||||||
| HC 3.1 In-patient long-term nursing care | 15.6 | 16.8 | 16.6 | ||||||||||||||||||||||||||||||||||||
| HC 3.3 Long-term nursing care: home care | 6.5 | 8.3 | 9.4 | ||||||||||||||||||||||||||||||||||||
| HC 4.1 Clinical laboratory and diagnostic imaging | 3.7 | 3.2 | 3.7 | ||||||||||||||||||||||||||||||||||||
| HC 4.3 Patient transport and emergency rescue | 2.5 | 2.5 | 2.8 | ||||||||||||||||||||||||||||||||||||
| HC 5 Medical goods dispensed to out-patients | 14.9 | 15.3 | 12.9 | ||||||||||||||||||||||||||||||||||||
| HC 6-7 Prevention and health administration | 2.9 | 3.1 | 2.9 | ||||||||||||||||||||||||||||||||||||
| Current expenditure on health, HC 1:7 | 100 | 100 | 100 | ||||||||||||||||||||||||||||||||||||
|
Total expenditure on health measures the final consumption of health care goods and services (i.e. current health expenditures) in addition to capital investment in health care infrastructure. This includes spending by public and private sources (including households) on medical goods and services, public health, preventive health care programmes and administration. The two major components of total current health expenditure are expenditure on personal health care and expenditure on collective services. Personal health care services comprise curative care, rehabilitation, long-term health care, ancillary health care services, and medical goods dispensed to out-patients. Collective services comprise public health tasks such as health promotion and disease prevention services and health administration, which are delivered to society at large. Health expenditure also includes expenditure on health care and social services. According to international guidelines only expenditure for health care and social services that are health related should be included in the health accounts. Long-term nursing care is typically a mix of medical care and social care. Thus only the former is included here. |
Tables:
- Table 1 Health expenditure, key figures. 1997-2007
- Table 2 Current expenditure on health, by function of care. 1997-2007. NOK million
- Table 3 Total current expenditure on health by function, distributed by source of funding. 2005. Per cent
- Table 4 Total current expenditure on health by function, distributed by source of funding. 2003. Per cent
- Table 5 Total current expenditure on health by function, distributed by source of funding. 2000. Per cent
- Table 6 Total current expenditure on health by function, distributed by source of funding. 1997. Per cent
- Table 7 Total current expenditure by provider distributed by source of funding. 2005. Per cent
- Table 8 Total current expenditure by provider distributed by source of funding. 2003. Per cent
- Table 9 Total current expenditure by provider distributed by source of funding. 1997. Per cent
Contact
-
Eirik Larsen Lindstrøm
E-mail: eirik.lindstrom@ssb.no
tel.: (+47) 46 78 22 92