Content
Published:
This is an archived release.
Health expenditure doubled in last decade
Norway is ranked fourth among the OECD countries in terms of per capita total health expenditure with NOK 40 000 in 2006. 84 per cent of the health spending is financed by the government. The total health expenditure nearly doubled from 1997 to 2006.

The per capita total health expenditure is relatively high in Norway compared to other OECD countries. The spending is more than 50 per cent higher than the OECD average. Only the US, Luxemburg and Switzerland have higher per capita spending.
Since 1997, Norwegian health expenditure has increased, and despite some annual fluctuations, the overall spending has almost doubled. The health expenditure to GDP ratio varied between 8.4 and 10 per cent, with the highest share in 2003. This decreased to 8.7 in 2006. The Norwegian share of GDP is higher than the OECD average over the period 1997-2006. In 2004, the OECD average was just below 9 per cent. In comparison, the GDP rate for the US, Switzerland and Germany was 15.3, 11.6 and 10.6 respectively.
Between 1997 and 2006, health spending in real terms increased by almost 4 per cent on average. Gross capital formation showed a higher growth rate than the current health expenditure, particularly in the first part of the period. This is due to a political action plan and programmes for long-term health care (1998-2001). The annual growth rate for spending on the various health functions differs. Expenditure on day care increased by 10 per cent a year, whereas in-patient care had a far lower growth rate.
| Health expenditure, key figures. 1997-2006 |
| 1997 | 1998 | 1999 | 2000 | 2001 | 2002 | 2003 | 2004 | 2005* | 2006* | ||||||||||||||||||||||||||||||
|---|---|---|---|---|---|---|---|---|---|---|---|---|---|---|---|---|---|---|---|---|---|---|---|---|---|---|---|---|---|---|---|---|---|---|---|---|---|---|---|
| Total expenditure on health. NOK million | 94 008 | 105 500 | 115 711 | 124 728 | 135 266 | 150 029 | 159 572 | 168 237 | 176 031 | 186 396 | |||||||||||||||||||||||||||||
| HC R.1 Capital formation of health care provider institutions. NOK million | 5 635 | 7 480 | 8 945 | 8 496 | 9 778 | 9 528 | 10 262 | 10 956 | 11 411 | 11 780 | |||||||||||||||||||||||||||||
| Total current expenditure on health. NOK million | 88 373 | 98 021 | 106 766 | 116 232 | 125 488 | 140 501 | 149 310 | 157 281 | 164 620 | 174 616 | |||||||||||||||||||||||||||||
| Total expenditure on health in current prices in per cent of GDP | 8.4 | 9.3 | 9.3 | 8.4 | 8.8 | 9.8 | 10.0 | 9.7 | 9.1 | 8.7 | |||||||||||||||||||||||||||||
| Total expenditure on health in current prices in per cent of GDP Mainland Norway | 10.2 | 10.6 | 11.1 | 11.2 | 11.5 | 12.3 | 12.5 | 12.4 | 12.2 | 11.9 | |||||||||||||||||||||||||||||
| Total expenditure on health in current prices per capita | 21 340 | 23 807 | 25 933 | 27 773 | 29 968 | 33 059 | 34 957 | 36 638 | 38 075 | 39 993 | |||||||||||||||||||||||||||||
| Total expenditure on health at constant NOK in 2000 per capita | 24 606 | 25 781 | 27 233 | 27 773 | 28 564 | 30 694 | 31 345 | 32 036 | 32 619 | 32 939 | |||||||||||||||||||||||||||||
Public spending on what?
The public share of total health expenditure in Norway is high compared to other OECD countries. 84 per cent of expenditure on health is financed by the government. The public spending on health accounts for an increasing share of total public spending. This share has risen from below 16 per cent in 1997 to slightly above 19 per cent in 2006. In the OECD area, the proportion of public spending on health shows large variations. The US ranks highest in terms of per capita spending, but has the lowest share of public spending, about 45 per cent. On the other hand, Luxemburg ranks second in terms of per capita spending, but the public spending accounts for 90 per cent. Norway has about the same public share as Iceland and Sweden.
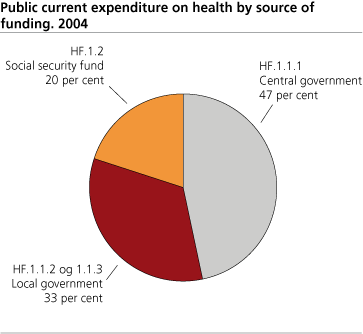
The final figures for 2004 show that general government accounts for 47 per cent of the public funding, local government accounts for 33 per cent and the social security fund accounts for 20 per cent..
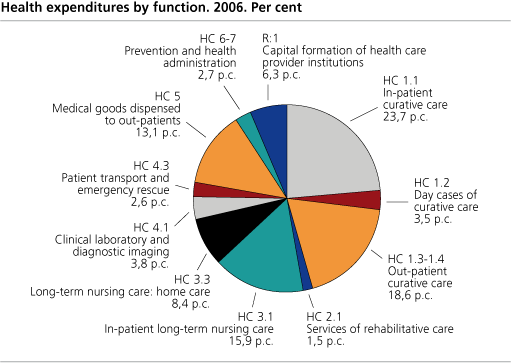
In-patient and day cases of curative care make up the highest share of central government expenditure. Day cases made up an increasing share during the period 1997-2006, from 2.3 to 3.5, whereas in-patient curative care decreased from 26.8 to 23.4.
| Health expenditures, by function in 1997, 2001 and 2004. Per cent |
| 1997 | 2001 | 2004 | |||||||||||||||||||||||||||||||||||||
|---|---|---|---|---|---|---|---|---|---|---|---|---|---|---|---|---|---|---|---|---|---|---|---|---|---|---|---|---|---|---|---|---|---|---|---|---|---|---|---|
| In-patient curative care | 26.8 | 25.2 | 23.4 | ||||||||||||||||||||||||||||||||||||
| Day cases of curative care | 2.3 | 3.2 | 3.5 | ||||||||||||||||||||||||||||||||||||
| Out-patient curative care | 20.1 | 18.0 | 18.5 | ||||||||||||||||||||||||||||||||||||
| Services of rehabilitative care | 1.5 | 1.4 | 1.4 | ||||||||||||||||||||||||||||||||||||
| In-patient long-term nursing care | 14.7 | 15.6 | 15.7 | ||||||||||||||||||||||||||||||||||||
| Long-term nursing care: home care | 6.1 | 7.4 | 8.3 | ||||||||||||||||||||||||||||||||||||
| Clinical laboratory and diagnostic imaging | 3.5 | 3.4 | 3.6 | ||||||||||||||||||||||||||||||||||||
| Patient transport and emergency rescue | 2.4 | 2.2 | 2.6 | ||||||||||||||||||||||||||||||||||||
| Medical goods dispensed to out-patients | 14.0 | 13.9 | 14.0 | ||||||||||||||||||||||||||||||||||||
| Prevention and health administration | 2.7 | 2.5 | 2.6 | ||||||||||||||||||||||||||||||||||||
| Capital formation of health care provider institutions | 6.0 | 7.2 | 6.5 | ||||||||||||||||||||||||||||||||||||
From January 2002, central government assumed responsibility for the specialist health service from the local government. Since then, the main component of local government health expenditure has been related to long-term nursing care. These services now account for a higher share of total health spending, increasing from almost 21 per cent in 1997 to 24 per cent in 2006. Between 1997 and 2006, expenditure on long-term nursing home care increased far more than the average for all services, increasing its share of total health spending from 6.1 to 8.4 per cent. In contrast, the share of in-patient long-term nursing care remained stable during the period.
The social security fund accounts for about 20 per cent of public health spending. In recent years some of their responsibilities have been transferred to central government, i.e. patient transportation. A large share of the security fund's health expenses is on medical goods, including pharmaceuticals. The share of public spending channelled through the social security fund was around 60 per cent over the period, and slightly lower in recent years.
|
Total expenditure on health measures the final consumption of health care goods and services (i.e. current health expenditures) in addition to capital investment in health care infrastructure. This includes spending by public and private sources (including households) on medical goods and services, public health, preventive health care programmes and administration. The two major components of total current health expenditure are expenditure on personal health care and expenditure on collective services. Personal health care services comprise curative care, rehabilitation, long-term health care, ancillary health care services, and medical goods dispensed to out-patients. Collective services comprise public health tasks such as health promotion and disease prevention services and health administration, which are delivered to society at large. Health expenditure also includes expenditure on health care and social services. According to international guidelines only expenditure for health care and social services that are health related should be included in the health accounts. Long-term nursing care is typically a mix of medical care and social care. Thus only the former is included here. The most important sources for compiling health expenditure are public accounts and statistics from public and private hospitals (specialist nursing homes, convalescence and rehabilitation institutions and hospitals). Health expenditure is defined according to the System of Health Accounts (OECD 2000). |
Revision of GDP
There has been a revision of the Norwegian national accounts back to 1970. As a result, the level of GDP at current prices has risen 0.8 per cent on average. The year-to-year growth rates of GDP in constant prices have also been revised. The health expenditures have not been changed, but the revised GDP figures will influence the GDP share of health figures.
Tables:
- Table 1 Health expenditure, key figures. 1997-2005
- Table 2 Current expenditure on health, by function of care. 1997-2006. NOK million
- Table 3 Total current expenditure on health by function, distributed by source of funding. 2004. Per cent
- Table 4 Total current expenditure on health by function, distributed by source of funding. 2003. Per cent
- Table 5 Total current expenditure on health by function, distributed by source of funding. 2000. Per cent
- Table 6 Total current expenditure on health by function, distributed by source of funding. 1997. Per cent
- Table 7 Total current expenditure by provider distributed by source of funding. 2004. Per cent
- Table 8 Total current expenditure by provider distributed by source of funding. 2003. Per cent
- Table 9 Total current expenditure by provider distributed by source of funding. 1997. Per cent
- Table 10 Total current expenditure by function distributed by provider. 2004. Per cent
- Table 11 Total current expenditure by function distributed by provider. 2003. Per cent
Contact
-
Eirik Larsen Lindstrøm
E-mail: eirik.lindstrom@ssb.no
tel.: (+47) 46 78 22 92