Content
Published:
This is an archived release.
Households’ financial assets increase
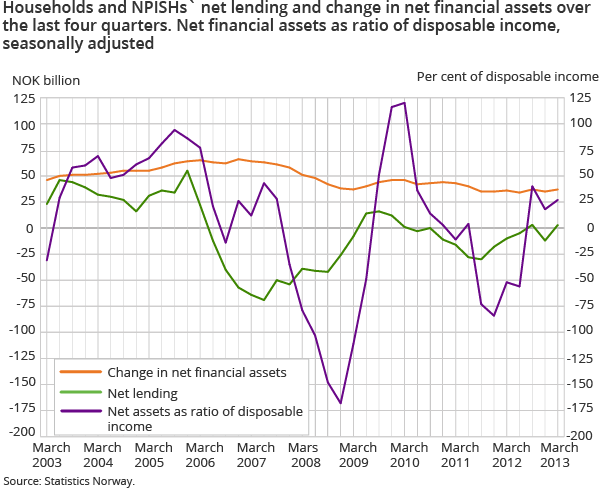
Households’ net financial assets increased by NOK 27 billion during the four-quarter period at the end of the first quarter of 2013. Both net holding gains and positive net lending led to the rise in the net financial assets.
| Non financial corp. etc. | Financial corporations | General government | Households and NPISH | Rest of the world | |
|---|---|---|---|---|---|
| 1st quarter 2013 | |||||
| Net financial assets, start of period | -2 648 385 | 333 738 | 4 870 761 | 428 548 | -2 984 661 |
| Net lending | -37 001 | 2 713 | 80 592 | 37 270 | -83 574 |
| Other changes | -30 159 | 9 008 | 305 158 | 22 103 | -306 109 |
| Net financial assets, end of period | -2 715 545 | 345 458 | 5 256 510 | 487 921 | -3 374 344 |
| 2nd quarter 2012 - 1st quarter 2013 | |||||
| Net lending (sum) | -68 193 | 37 501 | 385 453 | 3 002 | -357 763 |
| Other changes (sum) | -75 317 | 743 | 287 154 | 23 766 | -236 344 |
| Growth in debt (per cent) | 1.3 | 1.9 | 8.9 | 6.8 | 3.2 |
Households and non-profit institutions serving households’ net lending was NOK 3 billion in the four-quarter period to the first quarter of 2013. This was an increase of NOK 15 billion as compared to the year of 2012, and is mainly due to reduced borrowing, increased transactions in mutual funds and increased allocations in insurance technical reserves.
In the last four-quarter period to the end of first quarter of 2013, the households’ net holding gains were NOK 24 billion. Capital gains in the securities markets of NOK 27 billion in the third quarter of 2012 and NOK 22 billion in the first quarter of 2013, raised the financial wealth. Gains in the value of quoted shares, equity certificates, insurance technical reserves and mutual funds shares were the main contributors.
Lower debt growth for the households
The transactions in debt increased with NOK 171 billion during the last four-quarter period, a reduction of NOK 9 billion compared to the year of 2012. The households’ debt growth is mostly influenced by their borrowing from the financial institutions, which fell by NOK 8 billion to NOK 150 billion in the same period.
The estimated annual growth rate for the households’ total debt fell to 6.8 per cent by the end of the first quarter of 2013. The fall in the growth rate is partly due to the Easter Holidays, which were in March this year, and in April last year. The annual debt growth rate peaked at the end of second quarter of 2012, and has gradually fallen during the last three quarters.
Since the previous release of the financial accounts, a revision of the households’ historical series has been made due to an adjustment in the definition of the household sector. This has led to large revisions in both the balance sheet and the transactions. The revision has led to a higher level of financial assets and a lower level of debt in the households’ balance sheet. Also, the net lending from 2007 to 2011 has been upward adjusted, while the net lending in 2012 has been downward adjusted. The levels of the households’ asset to income ratio, debt to income ratio and net asset to income ratio are also affected by the revision.
The seasonal adjusted debt to income ratio increased by 0.6 percentage points during the first quarter of 2013, while the asset to income ratio increased by 2.1 percentage points. This led to an increase in the annual net asset to income ratio by 1.5 percentage points to 36.7 per cent at the end of the first quarter.
The households’ insurance technical reserves increase
Households’ transactions in financial assets were NOK 174 billion in the four-quarter period to the first quarter of 2013. This is an increase of NOK 5 billion compared to the previous four-quarter period. Increased allocations to insurance technical reserves contributed mainly to the transaction growth, along with purchases of mutual funds shares and equity certificates.
The transactions in deposits was at the same level as in the previous four-quarter period, and has kept well above NOK 60 billion during the last six four-quarter periods. We have to go back to the financial crisis around 2007-2008 to find transactions in deposits above NOK 60 billion.
Record high holding gains for the Central government
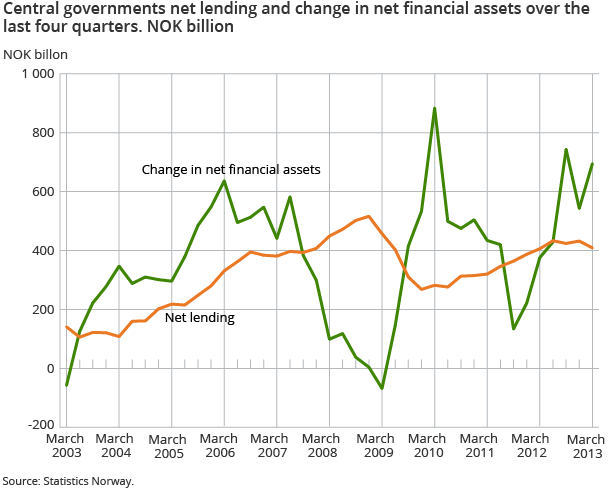
The Central government’s net holding gains are calculated to NOK 286 billion during the four-quarter period at the end of first quarter of 2013. In the first quarter of 2013, the Central government received a record high net holding gain of NOK 305 billion, of which NOK 281 billion were net holding gains in foreign financial assets. The net holding gains were mostly due to the exchange rate development and increased market prices in the foreign shares held by The Government Pension Fund Global.
The Central governments’ financial assets amounted to NOK 6 216 billion by the end of the first quarter 2013, of which the Government Pension Fund Global held assets of NOK 4 182 billion. NOK 3 236 billion of the Central governments’ total assets are invested in shares, of which NOK 2 642 billion are invested abroad. At the same time, the Central government had a total debt of NOK 793 billion, and the largest debt item of NOK 524 billion was in short and long term bonds. The debt also includes short term loans which are a part of the management of the Government Pension Fund Global.
The Central governments’ net lending in the four-quarter period to the end of the first quarter of 2013 is calculated to NOK 409 billion. Along with the net holding gains in the exchange rates and stock markets, this increased the net financial assets with NOK 695 billion to NOK 5 423 billion at the end of the first quarter of 2013.
The banks reduce their deposit in the rest of the world
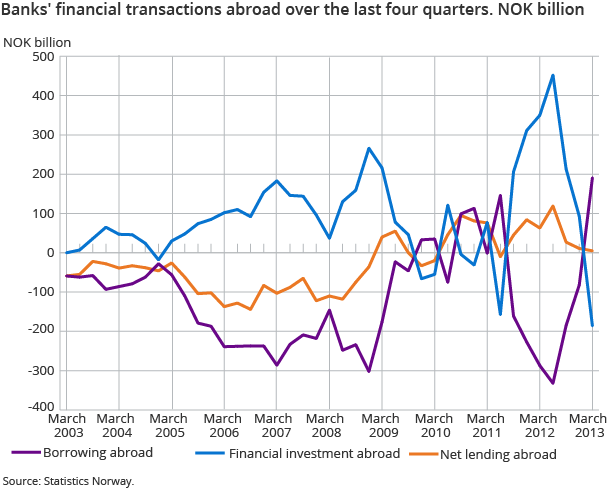
The domestic banks reduced their transactions in the rest of the world with NOK 186 billion in the four-quarter period to the end of the first quarter of 2013, while the rest of the world withdrew their investments in domestic banks with NOK 191 billion. Financial transactions from the rest of the world in domestic banks often correspond with financial transactions from the domestic banks to the rest of the world.
There are large volatilities in the quarterly transactions between the domestic banks and the rest of the world, especially in deposits. The main reasons for the volatility can be changes in the collateral in existing contracts, which is often invested in deposits and short term bonds, and payments in deposits connected to tax settlements. In the first quarter of 2013, the domestic banks withdrew NOK 143 billion in deposits in foreign banks. At the same time the rest of the world withdrew their deposits and short term bonds in domestic banks with NOK 94 billion and NOK 38 billion respectively.
Net foreign assets continue to increase
Norway’s foreign assets increased from NOK 7 822 billion at the end of the first quarter of 2012 to NOK 8 356 at the end of the first quarter of 2013. At the same time the debt decreased from NOK 5 041 billion to NOK 4 982 billion. Norway’s net assets therefore increased from NOK 2 780 billion to NOK 3 374 billion.
Contact
-
Torbjørn Cock Rønning
E-mail: torbjorn.cock.ronning@ssb.no
tel.: (+47) 97 75 28 57
-
Jon Ivar Røstadsand
E-mail: jon-ivar.rostadsand@ssb.no
tel.: (+47) 21 09 43 69
-
Marit Eline Sand
E-mail: marit.sand@ssb.no
tel.: (+47) 40 90 26 74


