Content
Published:
This is an archived release.
Debt to income ratio increases
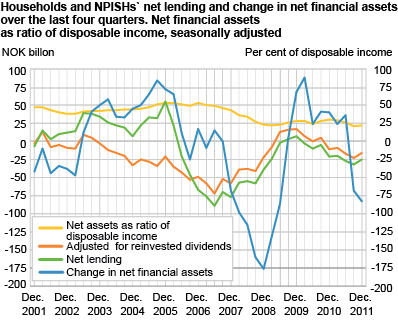
Households and non-profit institutions serving households’ debt amounted to 206.5 per cent of disposable income at the end of the fourth quarter of 2011. The seasonally- adjusted debt to income ratio increased by 1.2 percentage points from the third to the fourth quarter last year.
The debt to income ratio increased during 2011 and at end of the year the ratio attained the highest calculated level since 1995. Increased debt to income ratio reflects the fact that debt has grown faster than income. The growth in total debts is calculated to 7.1 per cent, which is 0.6 percentage points higher compared to 2010. Debt development however has stabilised, with growth rates at about the same level in the last three quarters of 2011.
Households’ borrowing continued to increase
Households’ total net lending was calculated to NOK -25 billion in 2011, which is nearly NOK 4 billion lower compared to 2010. Households borrowed NOK 166 billion in the last year and this is up about NOK 21 billion from 2010. Investments in financial assets amounted to NOK 141 billion in 2011. This is up almost NOK 17 billion from the previous year and particularly bank deposits contributed to the growth in financial investments.
Households’ net financial assets fell by NOK 83 billion from the end 2010 to the end of 2011. The development is mainly due to huge holding losses on quoted securities. However, net financial assets showed a modest increase by nearly NOK 4 billion during the fourth quarter of 2011. Net financial assets are quantified to NOK 248 billion at the end of 2011. This constituted 54 per cent of net financial assets at the end of the second quarter of 2007, before financial turmoil and the financial crisis caused large net holding losses.
Huge growth in deposits between banks and rest of the world
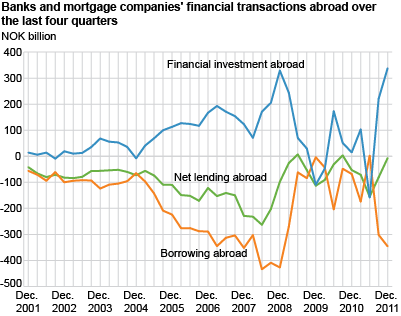
In 2011, foreigners placed funds totalling NOK 346 billion in domestic banks and mortgage companies, while banks and mortgage companies on the other hand placed funds totalling NOK 338 billion abroad. More than half of this was made up of transactions in deposits and deposits explain to a substantial degree the fluctuations in foreign transactions for banks and mortgage companies. In the last half of 2011, when the financial turmoil increased again, domestic banks received NOK 222 billion in deposits from the rest of the world. Simultaneous to this, 99 per cent of funds were replaced in foreign deposits. During the financial crisis in 2008, transactions in deposits were significant and deposits constituted over 40 per cent of domestic bank and mortgage borrowing abroad that year.
State’s net financial assets increase
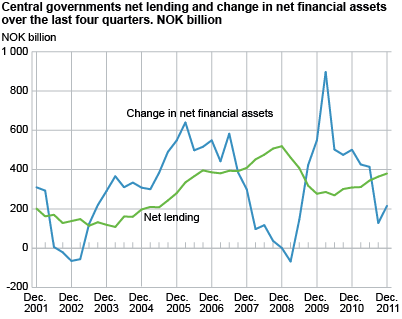
Central government’s net financial assets increased by NOK 216 billion during the last year. The development in state’s net financial assets has been highly affected by exchange rate developments in both the domestic and foreign securities markets in 2011. In particular, the drop in share prices in the second and third quarters of 2011 contributed to holding losses for central government of NOK 164 billion in the last year. In 2011, net lending was NOK 380 billion, which is NOK 71 billion higher than in 2010. Central government’s net financial assets were NOK 4 513 billion at the end of 2011. Of this, the market value of the Norwegian Government Pension Fund Global amounted to NOK 3 312 billion.
Local government’s borrowing drops
Local government’s net lending shows a significant improvement and is estimated at NOK
-17 billion in 2011 compared to NOK -33 billion in 2010. The development is mainly explained by a fall in borrowing, from NOK 47 billion in 2010 to NOK 25 billion last year. Local government debt amounted to NOK 456 billion at the end of 2011, but debt development in 2011 is burdened by preliminary and incomplete estimates of internal debt in local government. Investments in financial assets were quantified to NOK 8 billion in 2011, which is nearly NOK 6 billion lower than in 2010.
Net foreign assets increase
Norway’s net foreign assets went up by NOK 233 billion to NOK 2 706 billion from the end of the third to the end of the fourth quarter of 2011. Norway’s net lending abroad was NOK 112 billion in the fourth quarter of 2011, which is up NOK 2 billion from the previous quarter. Net holding gains, mainly due to developments in global security markets, increased the value of net financial assets abroad by NOK 121 billion in the fourth quarter of 2011.
| 3. quarter 2009 | 4. quarter 2009 | 1. quarter 2010 | 2. quarter 2010 | 3. quarter 2010 | 4. quarter 2010 | 1. quarter 2011 | 2. quarter 2011 | 3. quarter 2011 | 4. quarter 2011 | ||||||||||||||||||||||||||||||||||||||||||||||||||||||||||||||||||||||
|---|---|---|---|---|---|---|---|---|---|---|---|---|---|---|---|---|---|---|---|---|---|---|---|---|---|---|---|---|---|---|---|---|---|---|---|---|---|---|---|---|---|---|---|---|---|---|---|---|---|---|---|---|---|---|---|---|---|---|---|---|---|---|---|---|---|---|---|---|---|---|---|---|---|---|---|---|---|---|---|
| Financial assets | 6 042 | 6 000 | 6 320 | 6 686 | 6 667 | 6 877 | 7 114 | 7 018 | 7 231 | 7 185 | |||||||||||||||||||||||||||||||||||||||||||||||||||||||||||||||||||||
| Liabillities | 4 185 | 4 174 | 4 283 | 4 499 | 4 346 | 4 486 | 4 669 | 4 482 | 4 758 | 4 479 | |||||||||||||||||||||||||||||||||||||||||||||||||||||||||||||||||||||
| Net financial assets/net financial wealth | 1 856 | 1 827 | 2 037 | 2 187 | 2 322 | 2 391 | 2 444 | 2 536 | 2 473 | 2 706 | |||||||||||||||||||||||||||||||||||||||||||||||||||||||||||||||||||||
| Change in net financial assets/net financial wealth | 195 | -30 | 210 | 150 | 135 | 69 | 53 | 91 | -63 | 233 | |||||||||||||||||||||||||||||||||||||||||||||||||||||||||||||||||||||
| Other changes | 133 | -110 | 125 | 74 | 71 | -17 | -26 | -2 | -173 | 121 | |||||||||||||||||||||||||||||||||||||||||||||||||||||||||||||||||||||
| Net lending | 61 | 80 | 85 | 77 | 64 | 86 | 80 | 93 | 110 | 112 | |||||||||||||||||||||||||||||||||||||||||||||||||||||||||||||||||||||
DefinitionsNet lending as defined in non-financial accounts (capital account) = savings + net capital transfers - net acquisition of non-financial assets Net lending as defined in financial accounts = net acquisition of financial assets - net incurrence of liabilities Savings is non-consumed income and can be invested in financial or non-financial assets. If savings exceed non-financial investments, a sector has a surplus of funds and becomes a net lender to other sectors. In the financial transaction account, this means that the sector acquires more financial assets than liabilities. On the other hand, if savings are less than non-financial investments, investments have to be funded either by selling financial assets or incurring debts. Household investments in non-financial assets mainly reflect the purchase of new housing and fixed investments by unincorporated enterprises. They typically finance substantial parts of these investments by incurring debt in the form of loans. Net financial assets (net financial wealth) = total financial assets - total liabilities The financial balance sheet shows the financial position of a sector at the end of the reference period and is broken down into the categories of financial assets and liabilities. Insurance technical reserves, currency and deposits are the predominant assets held by households, while loans provided by financial corporations (banks etc.) constitute the main proportion of liabilities. Changes in net financial assets = net lending + other changes in assets, net The change in the financial balance sheet during the reference period is a result of accumulated financial transactions and other changes in assets. The latter category mainly reflects revaluations due to changes in market prices of financial instruments. |
Contact
-
Torbjørn Cock Rønning
E-mail: torbjorn.cock.ronning@ssb.no
tel.: (+47) 97 75 28 57
-
Jon Ivar Røstadsand
E-mail: jon-ivar.rostadsand@ssb.no
tel.: (+47) 21 09 43 69
-
Marit Eline Sand
E-mail: marit.sand@ssb.no
tel.: (+47) 40 90 26 74


