Content
Published:
This is an archived release.
Huge losses and declining debt growth
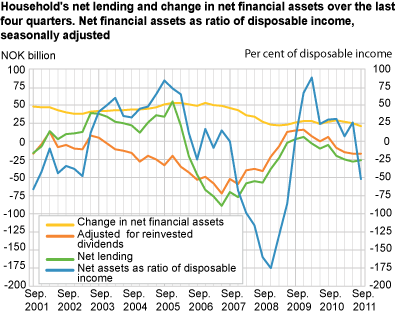
Households and non-profit institutions serving households’ debt amounted to 201.9 per cent of disposable income at the end of the third quarter of 2011. This is on a par with the debt to income ratio in the five previous quarters. Net assets as a ratio of disposable income fell by 3.7 percentage points as a consequence of huge holding losses.
Households’ total net lending over the four last quarters showed a marginal improvement of NOK 1 billion from the second to the third quarter of 2011. In the four-quarter period to the end of the third quarter of 2011, net lending is quantified to NOK -26 billion. The development is explained by a modest fall in borrowing by about NOK 2 billion.
Households’ borrowing from financial corporations continued to increase
Households borrowed NOK 150 billion in the last four-quarter period. The growth in total debts is calculated to 6.5 per cent, which is 0.2 percentage points lower compared to the previous four-quarter period. Lending from financial corporations to households showed a moderate increase, while households paid off other debt. Investments in financial assets over the four last quarters amounted to NOK 124 billion. This is down NOK 1 billion from the previous four-quarter period.
Households’ net financial assets fell by NOK 59 billion in the third quarter of 2011. This is the largest fall in net financial assets in one single quarter since the third quarter of 2008. The development is mainly due to huge holding losses on quoted securities. Net financial assets are quantified to NOK 249 billion at the end of the last quarter and constituted 54 per cent of net financial assets at the end of the second quarter of 2007, before financial turmoil and the financial crisis caused large net holding losses. Net assets as a ratio to income are quantified to 21.1 per cent of disposable income at the end of the third quarter. This is lower than during the financial crisis, when the lowest ratio was quantified to 21.5 per cent in the end of the first quarter of 2009.
State’s net financial assets fell for the second quarter in a row
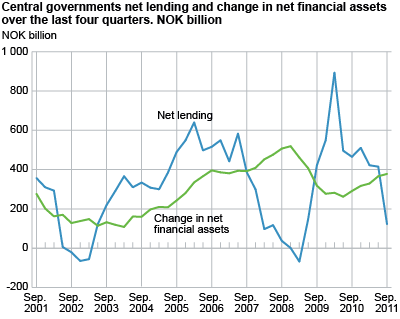
Central government’s net financial assets fell by NOK 132 billion in the third quarter of 2011. The drop is mainly due to negative developments in domestic and foreign securities markets. In the last four-quarter period, net lending was NOK 378 billion. Simultaneously, holding losses during the first three quarters of 2011contributed to an overall holding loss of NOK 256 billion in the last four-quarter period. Central government’s net financial assets increased by NOK 122 billion from the end of the third quarter of 2010 to NOK 4 219 billion at the end of the third quarter of 2011.
Borrowing flattens out in local government debt
Local government’s net lending shows a modest improvement of NOK 1 billion to NOK -25 billion in the four-quarter period to the end of the third quarter of 2011. The development is explained by a moderate fall in both borrowing and investments in financial assets. Borrowing amounted to NOK 38 billion in the last period, which is on a par with borrowing in the previous four-quarter period. Local government debt amounted to NOK 445 billion at the end of the third quarter of 2011 compared to NOK 436 billion at the end of the previous quarter. The debt development is burdened by incomplete estimates of internal debt in local government. Investments in financial assets were quantified to NOK 12 billion in the four-quarter period to the end of the third quarter of 2011, which is the same as in the previous four-quarter period.
Net holding losses abroad
Norway’s net foreign assets were calculated to NOK 2 499 billion at the end of the third quarter of 2011. This is down by NOK 44 billion from the end of the second quarter of 2011. Norway’s net lending abroad was NOK 117 billion in the third quarter of 2011, which is up by NOK 17 billion from the previous quarter. Net holding losses, mainly due to negative developments in global security markets, reduced the value of net financial assets abroad by NOK 161 billion in the third quarter of 2011.
|
2. quarter
2009 |
3. quarter
2009 |
4. quarter
2009 |
1. quarter
2010 |
2. quarter
2010 |
3. quarter
2010 |
4. quarter
2010 |
1. quarter
2011 |
2. quarter
2011 |
3. quarter
2011 |
||||||||||||||||||||||||||||||||||||||||||||||||||||||||||||||||||||||
|---|---|---|---|---|---|---|---|---|---|---|---|---|---|---|---|---|---|---|---|---|---|---|---|---|---|---|---|---|---|---|---|---|---|---|---|---|---|---|---|---|---|---|---|---|---|---|---|---|---|---|---|---|---|---|---|---|---|---|---|---|---|---|---|---|---|---|---|---|---|---|---|---|---|---|---|---|---|---|---|
| Financial assets | 6 068 | 6 066 | 6 000 | 6 319 | 6 677 | 6 648 | 6 877 | 7 116 | 7 041 | 7 265 | |||||||||||||||||||||||||||||||||||||||||||||||||||||||||||||||||||||
| Liabillities | 4 375 | 4 182 | 4 174 | 4 289 | 4 508 | 4 349 | 4 486 | 4 659 | 4 498 | 4 766 | |||||||||||||||||||||||||||||||||||||||||||||||||||||||||||||||||||||
| Net financial assets/net financial wealth | 1 693 | 1 884 | 1 827 | 2 030 | 2 169 | 2 298 | 2 391 | 2 457 | 2 543 | 2 499 | |||||||||||||||||||||||||||||||||||||||||||||||||||||||||||||||||||||
| Change in net financial assets/net financial wealth | 336 | 191 | -57 | 203 | 139 | 129 | 93 | 66 | 86 | -44 | |||||||||||||||||||||||||||||||||||||||||||||||||||||||||||||||||||||
| Other changes | 261 | 130 | -137 | 111 | 56 | 58 | -1 | -17 | -14 | -161 | |||||||||||||||||||||||||||||||||||||||||||||||||||||||||||||||||||||
| Net lending | 75 | 61 | 80 | 92 | 84 | 71 | 94 | 83 | 100 | 117 | |||||||||||||||||||||||||||||||||||||||||||||||||||||||||||||||||||||
Main revision of non-financial accounts in Norwegian system of national accountsRevised non-financial sector accounts were released on 22 November 2011. Time series are revised backward to the first quarter of 2003. Revised figures for disposable income are used in the calculations of financial assets to income ratio, debt to income ratio and net financial assets to income ratio. Revised income figures explain changes in the ratios. |
DefinitionsNet lending as defined in non - financial accounts ( capital account ) = savings + net capital transfers - net acquisition of non - financial assets Net lending as defined in financial accounts = net acquisition of financial assets - net incurrence of liabilities Savings is non-consumed income and can be invested in financial or non-financial assets. If savings exceed non-financial investments, a sector has a surplus of funds and becomes a net lender to other sectors. In the financial transaction account, this means that the sector acquires more financial assets than liabilities. On the other hand, if savings are less than non-financial investments, investments have to be funded either by selling financial assets or incurring debts. Household investments in non-financial assets mainly reflect the purchase of new housing and fixed investments by unincorporated enterprises. They typically finance substantial parts of these investments by incurring debt in the form of loans. Net financial assets ( net financial wealth ) = total financial assets - total liabilities The financial balance sheet shows the financial position of a sector at the end of the reference period and is broken down into the categories of financial assets and liabilities. Insurance technical reserves, currency and deposits are the predominant assets held by households, while loans provided by financial corporations (banks etc.) constitute the main proportion of liabilities. Changes in net financial assets = net lending + other changes in assets , net The change in the financial balance sheet during the reference period is a result of accumulated financial transactions and other changes in assets. The latter category mainly reflects revaluations due to changes in market prices of financial instruments. |
Contact
-
Torbjørn Cock Rønning
E-mail: torbjorn.cock.ronning@ssb.no
tel.: (+47) 97 75 28 57
-
Jon Ivar Røstadsand
E-mail: jon-ivar.rostadsand@ssb.no
tel.: (+47) 21 09 43 69
-
Marit Eline Sand
E-mail: marit.sand@ssb.no
tel.: (+47) 40 90 26 74


