Content
Published:
This is an archived release.
State’s net financial assets at record high
For the first time, central government’s net financial assets exceeded NOK 4 000 billion. Both net lending and net holding gains contributed to the increase in net financial assets during the third quarter of 2010.
Central government’s net financial assets are calculated to NOK 4 093 billion at the end of the third quarter of 2010, which is NOK 156 billion higher than at the end of the previous quarter. Central government’s net foreign assets amounted to NOK 2720 billion, while net domestic assets are calculated to NOK 1 373 billion. Nearly half of the state’s financial portfolio was invested in shares and equity at the end of the last quarter. The portfolio of shares and equity comprise both government pension fund’s equity holdings and the central government’s other owner shares in financial and non-financial corporations. The bond portfolio constituted a quarter of total financial assets. Total financial assets amounted to NOK 5 346 billion at the end of the third quarter of 2010, while the central government’s debt totalled NOK 1 253 billion. Almost NOK 589 billion is debt abroad, which to a large extent can be explained by use of repurchase agreements in portfolio management in the Government Pension Fund - Global.
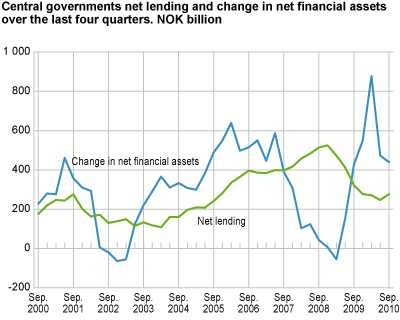
Central government’s net lending increases again
Central government’s net lending summarised over the last four quarters increased again after falling since the fourth quarter of 2008. Central government’s net lending is calculated to NOK 277 billion in the four quarter period to the third quarter of 2010. This is NOK 30 billion higher than in the last four quarter period.
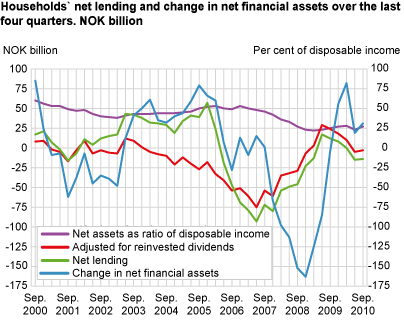
Stabilised development for households’ net lending
Households and non-profit institutions serving households’ borrowing has had a moderate development since the end of 2008. Households’ borrowing amounted to NOK 128 billion in the last four quarter period to the third quarter of 2010. This is nearly in line with the four quarter development for borrowing over the two first quarters of 2010. Households’ investments in financial assets are calculated to NOK 115 billion, which is an increase of NOK 4 billion from the previous to the last four quarter period.
Net lending is calculated to NOK -12 billion in the last four quarter period. This is a small improvement of NOK 3 billion compared to the previous four quarter period. Net holding gains amounted to NOK 43 billion and households’ net financial assets increased by NOK 31 billion in the four quarter period to the third quarter of 2010. Net financial assets are estimated to NOK 297 billion at the end of the quarter.
Local government’s net borrowing increases
The local government’s net lending over the last four quarters is calculated to NOK -22 billion, which is NOK 6 billion lower than the four quarter period to the second quarter of 2010. The development is explained mainly by borrowing, which is almost NOK 7 billion higher than the previous four quarter period. This is due to a higher net incurrence of loans of NOK 3 billion, increased net incurrence of securities by more than NOK 2 billion and net incurrence of other debt increased by NOK 1 billion.
Local government’s net borrowing increased by NOK 20 billion from the end of the second quarter of 2010 to NOK 108 billion at the end of the third quarter of 2010. The development in the third quarter of 2010 is explained by a decrease in financial assets while at the same time increasing their borrowing. At the end of the last quarter, the local government had a total debt of NOK 388 billion.
Net holding gains towards the rest of the world
Norway’s net foreign assets were calculated to NOK 2 293 billion at the end of the third quarter of 2010. This is up by NOK 102 billion from the end of the second quarter of 2010. Norway’s net lending abroad was NOK 64 billion in the last quarter. Net holding gains due to exchange rate developments in foreign exchange and global security markets contributed to increase the net financial assets abroad by NOK 38 billion in the third quarter of 2010.
| 2. quarter 2008 | 3. quarter 2008 | 4. quarter 2008 | 1. quarter 2009 | 2. quarter 2009 | 3. quarter 2009 | 3. quarter 2009 | 1. quarter 2010 | 2. quarter 2010 | 3. quarter 2010 | ||||||||||||||||||||||||||||||||||||||||||||||||||||||||||||||||||||||
|---|---|---|---|---|---|---|---|---|---|---|---|---|---|---|---|---|---|---|---|---|---|---|---|---|---|---|---|---|---|---|---|---|---|---|---|---|---|---|---|---|---|---|---|---|---|---|---|---|---|---|---|---|---|---|---|---|---|---|---|---|---|---|---|---|---|---|---|---|---|---|---|---|---|---|---|---|---|---|---|
| Financial assets | 5 491 | 5 798 | 6 465 | 5 954 | 6 151 | 6 156 | 6 135 | 6 465 | 6 790 | 6 748 | |||||||||||||||||||||||||||||||||||||||||||||||||||||||||||||||||||||
| Liabillities | 4 283 | 4 385 | 4 930 | 4 600 | 4 452 | 4 258 | 4 247 | 4 364 | 4 599 | 4 455 | |||||||||||||||||||||||||||||||||||||||||||||||||||||||||||||||||||||
| Net financial assets / net financial wealth | 1 208 | 1 413 | 1 535 | 1 353 | 1 699 | 1 898 | 1 889 | 2 101 | 2 191 | 2 293 | |||||||||||||||||||||||||||||||||||||||||||||||||||||||||||||||||||||
| Change in net financial assets / net financial wealth | 2 | 205 | 122 | -181 | 346 | 199 | -10 | 213 | 90 | 102 | |||||||||||||||||||||||||||||||||||||||||||||||||||||||||||||||||||||
| Other changes | -116 | 100 | -6 | -248 | 261 | 133 | -102 | 127 | 17 | 38 | |||||||||||||||||||||||||||||||||||||||||||||||||||||||||||||||||||||
| Net lending | 117 | 105 | 127 | 67 | 85 | 67 | 92 | 85 | 73 | 64 | |||||||||||||||||||||||||||||||||||||||||||||||||||||||||||||||||||||
DefinitionsNet lending as defined in non - financial accounts ( capital account ) = savings + net capital transfers - net acquisition of non - financial assets
Net lending as defined in financial accounts = net acquisition of financial assets - net incurrence of liabilities
Savings is non-consumed income and can be invested in financial or non-financial assets. If savings exceed non-financial investments, a sector has a surplus of funds and becomes a net lender to other sectors. In the financial transaction account, this means that the sector acquires more financial assets than liabilities. On the other hand, if savings are less than non-financial investments, investments have to be funded either by selling financial assets or incurring debts. Household investments in non-financial assets mainly reflect the purchase of new housing and fixed investments by unincorporated enterprises. They typically finance substantial parts of these investments by incurring debt in the form of loans.
Net financial assets ( net financial wealth ) = total financial assets - total liabilities
The financial balance sheet shows the financial position of a sector at the end of the reference period and is broken down into the categories of financial assets and liabilities. Insurance technical reserves, currency and deposits are the predominant assets held by households, while loans provided by financial corporations (banks etc.) constitute the main proportion of liabilities.
Changes in net financial assets = net lending + other changes in assets , net
The change in the financial balance sheet during the reference period is a result of accumulated financial transactions and other changes in assets. The latter category mainly reflects revaluations due to changes in market prices of financial instruments. |
Tables
Contact
-
Torbjørn Cock Rønning
E-mail: torbjorn.cock.ronning@ssb.no
tel.: (+47) 97 75 28 57
-
Jon Ivar Røstadsand
E-mail: jon-ivar.rostadsand@ssb.no
tel.: (+47) 21 09 43 69
-
Marit Eline Sand
E-mail: marit.sand@ssb.no
tel.: (+47) 40 90 26 74