Content
Published:
This is an archived release.
12,6 billions worth of culture
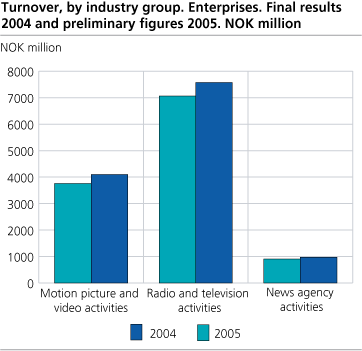
The enterprises within cultural services had a turnover of NOK 12,6 billion and employed 9 635 people in 2005, according to preliminary figures. The statistics consists of the industry groups radio and television activities, motion picture and video activities and news agency activities.
The enterprises within radio and television had a turnover of NOK 7,6 billion in 2005, and this is an 7 per cent increase from the previous year. Radio and television constitutes 60 per cent of total turnover within the cultural services. The enterprises employed 5 997 persons.
More news agencies
News agency activities also include freelance journalists and press photographers. The number of enterprises went up 15 per cent compared with 2005. The majority of these are small enterprises with 1 employee. Turnover amounted to NOK 969 million in 2005, an increase of almost 7,4 per cent compared with the previous year.
Growth within motion picture and video activities
Enterprises within motion picture and video activities had a 9 per cent increase in turnover compared with 2004, according to preliminary figures. The number of enterprises went up 12,2 per cent, and employment increased by 3,5 per cent to 2 810 persons
Preliminary figures
The preliminary figures for number of enterprises, turnover and employment are published while data are still being revised and may therefore deviate somewhat from final figures published at a later date. While preliminary figures are published on the enterprise level only, final figures are published on both the enterprise level and the local kind-of-activity unit level.
The method for calculating employment was changed in 2005. Because of this, employment figures for 2005 are not directly comparable with the figures for 2004. For more information, see About the statistics .
Tables:
The statistics is now published as Business statistics.
Contact
-
Statistics Norway's Information Centre
E-mail: informasjon@ssb.no
tel.: (+47) 21 09 46 42

