Updated
Next update
Not yet determined
Key figures
3 %
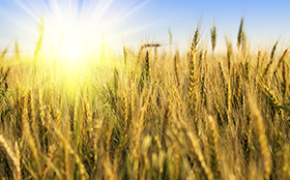
increase in use of pesticides in agriculture
| 2014 | Per cent change from | ||
|---|---|---|---|
| Tonnes active substance | 2011 - 2014 | 2005 - 2014 | |
| All pesticides | 328 | 3.0 | -7.2 |
| Fungicides | 73 | -9.6 | -23.1 |
| Insecticides | 1 | -7.7 | -52.0 |
| Herbicides | 228 | 6.4 | 2.2 |
| Other | 26 | 16.4 | -23.0 |
See selected tables from this statistics
Table 1
Holdings with spraying on area of different crops and area sprayed.
| 2014 | ||||||
|---|---|---|---|---|---|---|
| Holdings, total | Holdings with spraying | Holdings with spraying, per cent | Total area, decares1 | Area sprayed, decares | Per cent of area sprayed | |
| 1Refers to area on holdings with conventional production | ||||||
| Barley | 7 699 | 7 448 | 97 | 1 243 592 | 1 161 967 | 93 |
| Oats | 5 351 | 4 957 | 93 | 689 395 | 626 993 | 91 |
| Oil seeds | 468 | 374 | 80 | 40 766 | 32 335 | 79 |
| Potato | 1 932 | 1 359 | 70 | 122 855 | 120 732 | 98 |
| Onion | 88 | 80 | 91 | 6 368 | 6 346 | 100 |
| Carrot | 217 | 197 | 91 | 13 829 | 12 495 | 90 |
| Strawberry | 366 | 297 | 81 | 16 686 | 16 281 | 98 |
| Apple | 716 | 510 | 71 | 12 948 | 11 304 | 87 |
| Meadows for mowing and pastures | 31 875 | 9 445 | 30 | 6 251 769 | 398 944 | 6 |
| Spring wheat | 3 535 | 3 415 | 97 | 564 401 | 545 246 | 97 |
| Winter wheat | 1 519 | 1 442 | 95 | 203 610 | 196 700 | 97 |
| Common cabbage | 113 | 96 | 85 | 4 014 | 3 881 | 97 |
Table 2
Use of pesticides on area of different crops, by type of pesticide.
| Total area. Decares2 | Per cent of area sprayed with | |||||
|---|---|---|---|---|---|---|
| Herbicides | Fungicides | Insecticides | Growth regulators | Other products3 | ||
| 1Refers to area sprayed minimum one time. | ||||||
| 2Refers to area on holdings with conventional production | ||||||
| 3Other products includes defoliants and products for control of crested wheat grass | ||||||
| 2014 | ||||||
| Barley | 1 243 592 | 93 | 70 | 10 | 33 | 19 |
| Oats | 689 395 | 92 | 14 | 4 | 31 | 13 |
| Oil seeds | 40 766 | 38 | 22 | 65 | - | 11 |
| Potato | 122 855 | 96 | 95 | 59 | - | 83 |
| Onion | 6 368 | 100 | 99 | 65 | - | 8 |
| Carrot | 13 829 | 89 | 73 | 60 | - | - |
| Strawberry | 16 686 | 77 | 82 | 85 | - | 11 |
| Apple | 12 948 | 58 | 84 | 75 | : | : |
| Meadows for mowing and pastures | 6 251 769 | 6 | - | - | - | - |
| Spring wheat | 564 401 | 96 | 84 | 28 | 22 | 13 |
| Winter wheat | 203 610 | 96 | 88 | 21 | 66 | 7 |
| Common cabbage | 4 014 | 82 | 27 | 89 | - | - |
Table 3
Holdings with spraying on area of different crops. Share. Per cent
| 2014 | 2011 | |
|---|---|---|
| Meadows for mowing and pastures | 30 | 30 |
| Spring wheat | 97 | 97 |
| Winter wheat | 95 | 96 |
| Barley | 97 | 91 |
| Oats | 93 | 92 |
| Oil seeds | 80 | 78 |
| Potato | 70 | 66 |
| Onion | 91 | 87 |
| Carrot | 91 | 89 |
| Common cabbage | 85 | 79 |
| Strawberry | 81 | 80 |
| Apple | 71 | 67 |
Table 4
Use of pesticide in agriculture by type of pesticide. Tonnes active substance
| 2001 | 2003 | 2005 | 2008 | 2011 | 2014 | |
|---|---|---|---|---|---|---|
| All pesticides | 319 | 357 | 354 | 282 | 318 | 328 |
| Fungicides | 100 | 125 | 95 | 75 | 81 | 73 |
| Insecticides | 3 | 4 | 3 | 3 | 1 | 1 |
| Herbicides | 195 | 191 | 223 | 185 | 214 | 228 |
| Other | 20 | 37 | 33 | 20 | 22 | 26 |
About the statistics
The statistics show the use of pesticides and biological control agents in greenhouses and pesticide use in agriculture.
Definitions
-
Agricultural holding
A single unit both technically and economically, which has single management and which produces agricultural products. The holding is independent of municipality boundaries. The agricultural holding's headquarter must be located to an agricultural property.
Plant protection product
Substance whose purpose is to protect against or hamper attack on plants from harmful organisms, like animal pests, fungi and weeds, which cause harm to living plants, parts of plants or seed. Pesticides also include inter alia growth regulators and substances that kill parts of a plant.
The survey does not include pesticides used for staining of seeds or juvenile plants before they are planted out.
Agricultural area in use
Agricultural land that is harvested at least once during a year, including planted area of permanent crops, where no harvest has been produced so far. Includes also arable land included in the crop rotation system with no intention to produce a harvest during the year, but which will be harvested the next year.
Plot
A plot of land is the part of a field (or its entirety) used for a specific crop or a combination of crops.
Spot spraying
Spraying of part of plot, borderlines or against a particularly pest, e.g. nortern dock.
Meadows and pastureland
Includes cultivated and surface-cultivated meadow for mowing and pasturing including infield pasture.
Grain and oil-seeds
Includes barley, oats, spring wheat, winter wheat and oil-seeds. The survey does not include rye and triticale.
Taxes on pesticides
The taxes on pesticides consist of environmental taxes and control taxes.
Treated area
The basic area treated defined as the physical area of the crop treated at least once with a given active substance or group of substances, independently of the number of applications.
Gross treated area
The aggregate area of all repeated applications of any given plant protection product or group of plant protection products.
-
Agricultural area in use (concerning the survey of pesticide usage on arable crops):
0-99 decares
100-199 decares
200-299 decares
300- decaresPotato area:
1-4 decares
5-19 decares
20-49 decares
50- decaresOnion area:
1-19 decares
20- decaresCarrot, strawberry or apple area:
1-4 decares
5-19 decares
20- decaresMeadows and pastureland, barley, oats or spring wheat area:
1-49 decares
50-99 decares
100-199 decares
200- decaresWinter wheat area:
1-19 decares
20-49 decares
50-99 decares
100- decaresOil-seeds area:
1-49 decares
50- decares
Administrative information
-
Name: Pesticide use
Topic: Agriculture, forestry, hunting and fishing
-
Division for Housing, Property, Spatial and Agricultural Statistics
-
Only statistics for the whole country.
-
Every second or third year.
-
Eurostat
-
A data file with anonymous individual data is stored at Statistics Norway.
Background
-
The purpose of the survey, which is partly financed by the Norwegian Ministry of Agriculture and Food, is to shed light on pesticide use in agriculture.
The survey results serve as input to national authorities when monitoring and assessing health and environmental hazards of pesticide use.
The first survey of pesticide usage on arable crops was carried out for 2001, whereas the first on greenhouses was carried out for 2008.
-
Public administration and research institutions within agriculture and the environmental sector as well as professional organizations in agriculture.
-
Not relevant
-
The survey are based on "Guidelines for the Collection of Pesticide Usage Statistics within Agriculture and Horticulture" and A common methodology for the collection of pesticide usage statistics within agriculture and horticulture; issued by Eurostat.
-
Voluntary survey.
-
REGULATION (EC) No 1185/2009 OF THE EUROPEAN PARLIAMENT AND OF THE COUNCIL of 25 November 2009 concerning statistics on pesticides.
Production
-
The survey of pesticide use in greenhouse production comprises the following crops: cut flowers, flowering potted plants, bedding plants, decorative plants, lettuce, herbs, tomatoes and cucumbers.
The survey of pesticide usage on arable crops comprises the following crops: potatoes, onions, common cabbage, carrots, strawberries, apples, meadows and pastureland, barley, oats, spring wheat, winter wheat and oil-seeds. These crops comprised about 96 per cent of total agricultural area in use. The basic population for the survey was holdings applying for governmental subsidies as per 31 July. Holdings with mainly organic production or holdings under conversion to organic production were omitted.
-
Most of the data have been gathered via a questionnaire-based sample study. Area data from a survey concerning yield of crops in horticulture were used as frame for ornamental plants, lettuce, herbs, tomatoes, cucumbers, onions, common cabbage and carrots. For other crops, area data from the application for governmental subsidies were used as frame. Area data from these data sources were also used when presenting results from the survey.
The gross sample for the survey of pesticide usage in greenhouse production included 405 holdings in 2015. It was voluntary to respond the questionnaire. Nevertheless, the survey got a response rate of 84 per cent.
The gross sample for the survey of pesticide usage on arable crops included 4 234 holdings in 2014. It was voluntary to respond the questionnaire. The survey as a whole had a response rate of 59 per cent.
The sample for the survey of pesticide usage on arable crops was drawn in three steps:
- In step 1, the crops were ranged from the crop with fewest holdings to the crop with most holdings.
- In step 2 a measure for expected total use of pesticides per holding was estimated. Within each crop this load was proportionally distributed according to agricultural area of the holding (4 classes). The number of units in each sub-sample (crop) were proportionally distributed according to this distribution.
- In step 3 the holdings within each area class were sorted by number of crops and load before drawing the sample.
-
Data for the survey of pesticide use in greenhouse production was collected electronically. The questionnaire was made available to the respondents in January. Two written reminders were sent. The questionnaires were registered and then edited with aid of a computerized error-detection program.
Data for the survey of pesticide usage on arable crops was collected via a questionnaire distributed by mail to the person who according to the application for production subsidies was holder of the holding. The questionnaire was mailed to the respondents in December. One written reminder was sent.
The questionnaires were registered, optically scanned and then edited with aid of a computerized error-detection program. Data from applications for agricultural production subsidies were used during the control.
Concerning the survey of pesticide usage on arable crops the holdings in the population and in the sample were stratified by agricultural area in use (4 classes) and area of the surveyed crop (2-4 classes). The estimated weights had to give the correct number of holdings by agricultural area in use and by area of the surveyed crop. Furthermore, the weights had to give the correct area of the surveyed crops by the same stratification.
The holdings in the sample and in the population were stratified by utilized agricultural area (4 classes) and area of surveyed crops (2-4 classes). The estimated weights should give the correct number of holdings by utilized agricultural area and by area of the surveyed crops. Furthermore, the estimated weights should give the correct area of the surveyed crops by the same classification.
-
Not relevant
-
All results of a sample survey have a certain sampling error. The sampling error has been assessed by means of the number of observations and the coefficient of variation (VAR). The presentation of results is based on the following guidelines:
Max VAR - presentation of figures
Interval of VAR - presentation of figures in brackets
Min. no of observations
The whole country
-5 %
5 - -10 %
100
Subtotals/divisions
-10 %
10 - -20 %
20
Particulars within subtotals/divisions
- 20 %
20 - -30 %
10
Figures with greater VAR and/or based on fewer observations than described above are not presented and are thus indicated as colon (:). However, the guidelines have been derogated in a few cases where the VAR are just over the limits and there are quite many observations.
-
The first survey of pesticide use in greenhouse production was carried out in 2008. The surveys conducted in 2012 and 2015 had different methodology and the results are not directly comparable.
Surveys using the same methodology concerning pesticide usage on arable crops in Norway were carried out in 2001, 2003, 2005, 2008, 2011 and 2014.
Accuracy and reliability
-
Although measurement errors from the respondent may occur, the extent has not been investigated. Errors in connection with processing are expected to occur.
Farmers have to register use of pesticides in a log-book (fields and crops treated, pesticide products, doses and time of spraying). The farmers can use this information when completing the questionnaire.
-
Not relevant
Contact
-
Berit Bjørlo
-
Per Amund Aarstad