Content
Published:
This is an archived release.
Increase in landed value
Including crustaceans and molluscs, the landed value amounted to NOK 6.6 billion in the first six months of 2007, an increase of 12 per cent compared to the same period last year.
Norwegian vessels delivered 1.4 million tonnes of fish, up 6 per cent compared to the first six months of 2006.
The catch of herring, sand eel and capelin went up considerably, while the amount of blue whiting, saithe and sprat decreased.
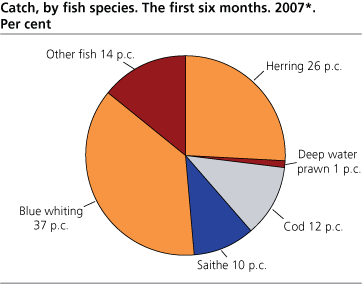
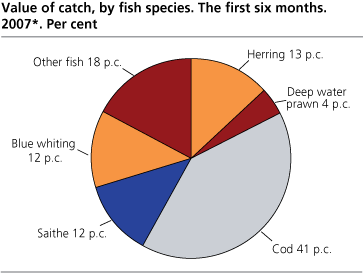
The cod catch increased by 5 per cent, and came to 162 000 tonnes, worth NOK 2.7 billion. This accounts for 12 per cent of the total catch quantity and 41 per cent of the catch value. Measured by the landed value of catch, cod fishing is the most important of fisheries.
The herring catch increased by 24 per cent compared with the first six months of 2006. Landed value of herring decreased from NOK 960 million to NOK 878 million. This corresponds to 26 per cent of the total catch and 13 per cent of the total landed value in 2007.
The catch of blue whiting decreased by 12 per cent, to 514 000 tonnes and accounted for 37 per cent of the total catch in the first six month of 2007.
52 per cent of the catch was used for consumption, while 48 per cent was used for meal, oil, animal feed etc. Almost the entire catch of blue whiting and sand eel, and 18 per cent of the herring catches were delivered for this production in 2007.
|
Quantity and value of catch, by the most important fish
species. The first six months. 2006-2007 |
| Tonnes live weight | NOK 1 000 | ||||||||||||||||||||||||||||||||||||||
|---|---|---|---|---|---|---|---|---|---|---|---|---|---|---|---|---|---|---|---|---|---|---|---|---|---|---|---|---|---|---|---|---|---|---|---|---|---|---|---|
| 2006* | 2007* | 2006* | 2007* | ||||||||||||||||||||||||||||||||||||
| Total | 1 309 425 | 1 385 943 | 5 894 039 | 6 605 688 | |||||||||||||||||||||||||||||||||||
| Cod | 154 902 | 162 088 | 2 201 927 | 2 673 426 | |||||||||||||||||||||||||||||||||||
| Haddock | 28 026 | 37 951 | 263 867 | 416 391 | |||||||||||||||||||||||||||||||||||
| Ling | 8 350 | 9 101 | 107 367 | 113 821 | |||||||||||||||||||||||||||||||||||
| Saithe | 149 667 | 139 073 | 897 487 | 820 092 | |||||||||||||||||||||||||||||||||||
| Greenland halibut | 4 709 | 3 633 | 94 321 | 64 621 | |||||||||||||||||||||||||||||||||||
| Redfish | 5 356 | 4 870 | 52 457 | 36 788 | |||||||||||||||||||||||||||||||||||
| Capelin | 1 557 | 40 598 | 2 238 | 93 126 | |||||||||||||||||||||||||||||||||||
| Norway pout | 2 827 | 1 432 | 3 167 | 1 879 | |||||||||||||||||||||||||||||||||||
| Blue whiting | 584 608 | 513 702 | 685 349 | 820 850 | |||||||||||||||||||||||||||||||||||
| Sandeel | 5 814 | 51 134 | 6 993 | 77 319 | |||||||||||||||||||||||||||||||||||
| Herring | 289 219 | 358 646 | 960 382 | 877 827 | |||||||||||||||||||||||||||||||||||
| Other fish1 | 52 091 | 47 330 | 305 993 | 323 581 | |||||||||||||||||||||||||||||||||||
| Deep water prawn | 22 300 | 16 385 | 312 489 | 285 969 | |||||||||||||||||||||||||||||||||||
| 1 | Included crustaceans and other molluscs. |
|
Quantity and value of catch, by disposition.
The first six months. 2007* |
| Tonnes live weight | NOK 1 000 | ||||||||||||||||||||||||||||||||||||||
|---|---|---|---|---|---|---|---|---|---|---|---|---|---|---|---|---|---|---|---|---|---|---|---|---|---|---|---|---|---|---|---|---|---|---|---|---|---|---|---|
| Total | 1 385 943 | 6 605 688 | |||||||||||||||||||||||||||||||||||||
| Consumption | 719 826 | 5 531 045 | |||||||||||||||||||||||||||||||||||||
| Meal and oil | 659 697 | 1 071 983 | |||||||||||||||||||||||||||||||||||||
| Feeding stuff, bait etc | 6 419 | 2 660 | |||||||||||||||||||||||||||||||||||||
Contact
-
Anne Turi Baklien
E-mail: anne.turi.baklien@ssb.no
tel.: (+47) 48 24 45 30
-
Terje Olav Rundtom
E-mail: terje.olav.rundtom@ssb.no
tel.: (+47) 91 38 60 61


