Content
Published:
This is an archived release.
Large catch of blue whiting
In the first six months of 2003, preliminary figures show that the blue whiting catch was 29 per cent higher than the total annual catch for 2002. This corresponds to 48 per cent of the total catch of fish but only 14 per cent of the total landed value. Almost the entire catch of blue whiting was used to manufacture meal and oil.
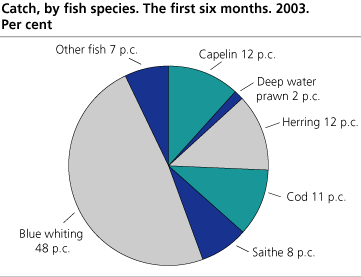
The catch came to 717 000 tonnes worth NOK 616 million.
Norwegian vessels delivered nearly 1.5 million tonnes fish in the first six months of 2003. Including crustaceans and molluscs, the landed value amounted to NOK 4.3 billion. Compared with preliminary figures for the first six months in 2002, the catch decreased 10 per cent in quantity and 28 per cent in landed value.
In addition to the catch of blue whiting, the catches of haddock and redfish increased by 22 and 7 per cent, respectively. Otherwise it was a decline in the catch of most of the fish species.
The herring catch came to 184 500 tonnes, worth NOK 496 000 million. Compared with the corresponding period in 2002 this is a 23 per cent decrease in quantity and about 50 per cent decrease in landed value.
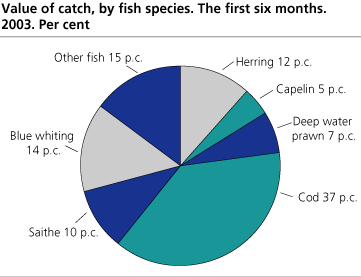
The cod catch fell from 178 800 tonnes to 161 400 tonnes. The value of the catch was NOK 1.6 billion. This corresponds to 11 per cent of the total catch and 37 per cent of the landed value.
Cod and haddock figures include fishing by Norwegian vessels on Russian quotas.
57 per cent of the total catch was made into meal, oil and animal food. Frozen fish accounted for 24 per cent.
|
Quantity and value of catch, by the most important fish
species. The first six months. 2002-2003. Tonnes. 1 000 NOK |
| Tonnes live weight | 1 000 NOK | ||||||||||||||||||||||||||||||||||||||
|---|---|---|---|---|---|---|---|---|---|---|---|---|---|---|---|---|---|---|---|---|---|---|---|---|---|---|---|---|---|---|---|---|---|---|---|---|---|---|---|
| 2002* | 2003* | 2002* | 2003* | ||||||||||||||||||||||||||||||||||||
| Total | 1 653 061 | 1 480 594 | 6 030 342 | 4 290 165 | |||||||||||||||||||||||||||||||||||
| Cod | 178 798 | 161 429 | 2 255 965 | 1 625 597 | |||||||||||||||||||||||||||||||||||
| Haddock | 26 421 | 25 502 | 284 336 | 174 105 | |||||||||||||||||||||||||||||||||||
| Ling | 8 008 | 8 303 | 116 018 | 86 558 | |||||||||||||||||||||||||||||||||||
| Saithe | 95 262 | 115 999 | 487 283 | 431 846 | |||||||||||||||||||||||||||||||||||
| Greenland halibut | 5 186 | 5 300 | 61 888 | 73 031 | |||||||||||||||||||||||||||||||||||
| Redfish | 10 064 | 10 744 | 49 902 | 51 254 | |||||||||||||||||||||||||||||||||||
| Capelin | 427 504 | 172 698 | 519 973 | 195 943 | |||||||||||||||||||||||||||||||||||
| Norway pout | 9 114 | 5 773 | 7 765 | 4 444 | |||||||||||||||||||||||||||||||||||
| Blue whiting | 417 091 | 717 405 | 420 583 | 615 623 | |||||||||||||||||||||||||||||||||||
| Sandeel | 170 833 | 20 477 | 157 952 | 16 530 | |||||||||||||||||||||||||||||||||||
| Herring | 240 381 | 184 498 | 1 060 629 | 496 085 | |||||||||||||||||||||||||||||||||||
| Other fish1 | 32 600 | 29 554 | 266 768 | 229 524 | |||||||||||||||||||||||||||||||||||
| Deep water prawn | 31 800 | 22 912 | 341 280 | 289 625 | |||||||||||||||||||||||||||||||||||
| 1 | Included crustaceans and other molluscs. |
|
Quantity and value of catch, by disposition. The
first six months. 2003. Tonnes. 1 000 NOK |
| Tonnes live weight | 1 000 NOK | ||||||||||||||||||||||||||||||||||||||
|---|---|---|---|---|---|---|---|---|---|---|---|---|---|---|---|---|---|---|---|---|---|---|---|---|---|---|---|---|---|---|---|---|---|---|---|---|---|---|---|
| Total | 1 480 594 | 4 290 165 | |||||||||||||||||||||||||||||||||||||
| Fresh | 109 083 | 844 220 | |||||||||||||||||||||||||||||||||||||
| Frozen, minced, roe1 | 357 118 | 1 480 589 | |||||||||||||||||||||||||||||||||||||
| Dried | 28 832 | 274 319 | |||||||||||||||||||||||||||||||||||||
| Salted etc.2 | 133 760 | 933 441 | |||||||||||||||||||||||||||||||||||||
| Canned | 971 | 11 427 | |||||||||||||||||||||||||||||||||||||
| Meal, oil, animal feed | 848 059 | 745 553 | |||||||||||||||||||||||||||||||||||||
| Bait and other dispositions | 2 770 | 617 | |||||||||||||||||||||||||||||||||||||
| 1 | Included shelled prawns. |
| 2 | Klipfish included. |
The statistics are based on data from the Directorate of Fisheries and are released semi-annually.
Contact
-
Anne Turi Baklien
E-mail: anne.turi.baklien@ssb.no
tel.: (+47) 48 24 45 30
-
Terje Olav Rundtom
E-mail: terje.olav.rundtom@ssb.no
tel.: (+47) 91 38 60 61