Content
Published:
Updated:
This is an archived release.
Farmers’ incomes up 7 per cent
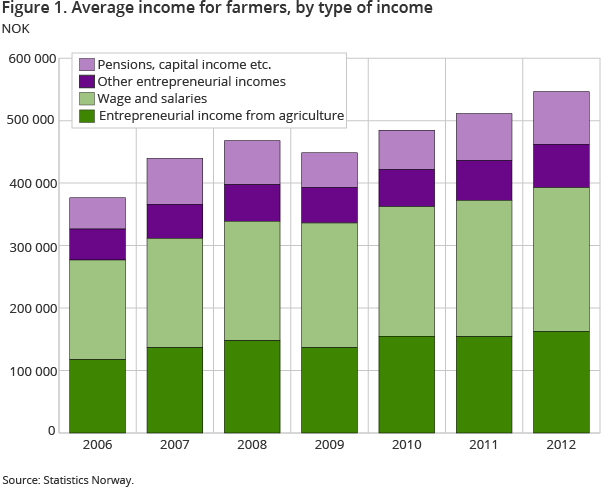
On average, gross income for farmers amounted to NOK 546 000 in 2012. This represents an increase of NOK 35 000, or 7 per cent, from the previous year. Entrepreneurial income from agriculture averaged NOK 162 000, constituting 30 per cent of the gross income in 2012.
| 2012 | Change in per cent | ||
|---|---|---|---|
| 2011 - 2012 | 2007 - 2012 | ||
| Personal holders (number) | 42 142 | -1.5 | -9.7 |
| Average income for holders (NOK) | 546 400 | 6.9 | 24.3 |
| Wages and salaries | 230 600 | 5.7 | 31.6 |
| Entrepreneurial income from agriculture | 162 300 | 5.4 | 19.1 |
| Other entrepreneurial income | 69 200 | 8.5 | 26.7 |
| Pensions | 41 700 | 14.9 | 96.7 |
| Capital income etc. | 42 800 | 10.0 | -18.2 |


Agricultural holdings vary considerably in size, from hobby-like production to holdings with a turnover of more than NOK 1 million. This is the main reason for the considerable variation in entrepreneurial income from agriculture and debt. In 2012, farmers’ average gross income was made up of NOK 272 000 from wages and pensions, NOK 231 000 from total entrepreneurial income and NOK 43 000 from capital income. Average entrepreneurial income from agriculture for all 42 100 farmers was NOK 162 000. About 29 900 farmers with a positive entrepreneurial income had an average agricultural income of NOK 229 000.
Variations between counties
Distributed by county, farmers in Akershus and Vestfold had the highest average gross incomes, with NOK 693 000 and NOK 662 000 respectively. Farmers in Troms had the lowest gross income, with an average of NOK 452 000. The largest average entrepreneurial income from agriculture was NOK 226 000 in Nord-Trøndelag, while farmers in Telemark had the lowest agricultural income, with NOK 93 000.
Low agricultural income in cereals production
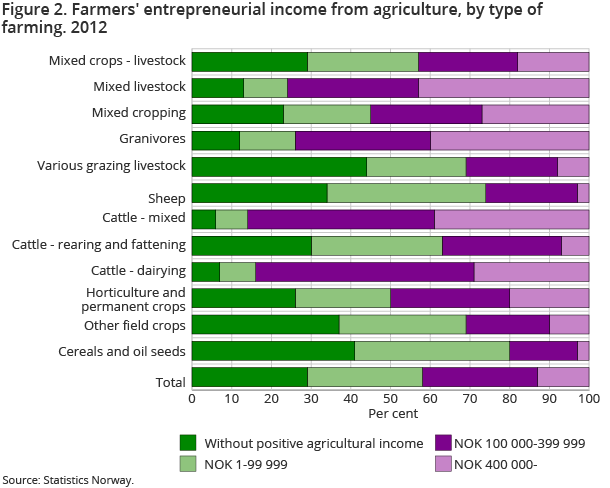
Agricultural holdings are classified by type of farming . Farmers with cereals and oilseeds as type of farming had the lowest entrepreneurial income from agriculture in 2012, with NOK 75 000. Only 7 per cent of farmers with specialist cereal and oilseed production had agriculture as the main source of income in 2012, and 41 per cent of these farmers had no positive income from agriculture. Farmers with cereal and oilseed production had the highest wage income among the types of farming, with NOK 334 000 on average.
Farmers with specialist cattle dairying increased their agricultural income by 8 per cent, to NOK 308 000 in 2012. These farmers had the lowest gross income, with NOK 482 000. The agricultural income for farmers with sheep amounted to NOK 80 000, almost the same as the previous year. For farmers with specialist pig/poultry, gross income amounted to NOK 687 000. Agricultural income increased by NOK 20 000, to an average of NOK 388 000 in 2012.
Most debt for farmers with pigs and poultry
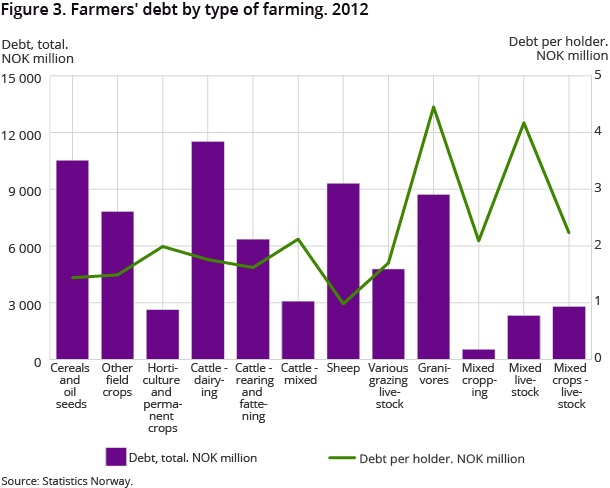
Farmers had a total debt of NOK 70.4 billion in 2012, corresponding to an average of NOK 1.7 million per farmer. The debt ranged from NOK 979 000 for farmers with specialist sheep up to NOK 4.4 million on average for farmers with specialist pig/poultry. For farmers in Østfold and Rogaland, debt amounted to NOK 2.3 million on average, while average debt in Sogn og Fjordane was NOK 961 000. About 19 per cent of the farmers had less than NOK 100 000 in debt, while 10 per cent had more than NOK 4 million in debt. Total interest paid in 2012 amounted to NOK 2.8 billion, with an average of NOK 65 500 per farmer.
What the statisical basis includes Open and readClose
The statistics are based on tax return data and comprise the population of agricultural holdings operated by a natural person. Of a total of 44 794 holdings in 2012, 42 142 holdings are included in these statistics.
Deductions, inter alia interest on debt, are not deducted from the income. The statistics are based on data sources where total debt could not be broken down into entrepreneurial debt and private debt.
Contact
-
Per Amund Aarstad
E-mail: per.amund.aarstad@ssb.no
tel.: (+47) 40 81 13 79
-
Berit Bjørlo
E-mail: berit.bjorlo@ssb.no
tel.: (+47) 40 81 13 76
