Content
Published:
This is an archived release.
Income growth in all counties
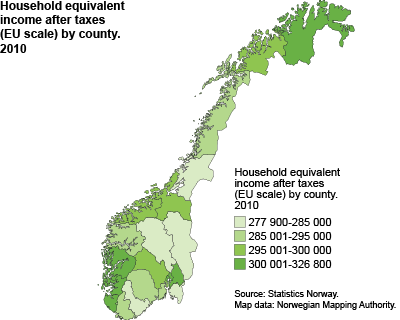
Household equivalent income after taxes rose by 19 per cent from 2004 to 2010, in 2010-prices. Households in Rogaland had the strongest income growth, by 22 per cent, while households in Akershus and Hedmark had the lowest growth, by 16 per cent.
Median equivalent income after tax in Rogaland was NOK 316 400 in 2010. Although Akershus is among the counties with weakest income growth this period, the median equivalent income is the highest in the country, at NOK 326 800.
Underlying dataThe household income statistics include all registered income in cash received by private households in Norway during the calendar year. Since 2004, the household income statistics have been based solely on register data and include all persons in private households living in Norway at the end of the year. The data are described in more detail in About the statistics.
Income per consumption unit (equivalent income)In order to be able to compare the incomes of different types of households, the household income is normally adjusted using equivalence scales or consumption weights . In this way, the income is calculated after tax per consumption unit. These consumer weights take into account that large households need higher incomes than small households in order to have an equivalent standard of living, and also that large households will benefit from economies of scale with regard to some goods (e.g. TVs, washing machines, newspapers, electricity costs etc.). There are numerous types of equivalence scales but there is no consensus of opinion on which scale is the best. In these statistics, the EU scale or the ’modified’ OECD scale is used. This is the most commonly used scale in Europe today. |
Tables:
The statistics is published with Income and wealth statistics for households.
Additional information
Some of the figures from households' income geographic distribution are available as open data with API.
The household income statistics include all registered income in cash received by private households in Norway during the calendar year. Since 2004, the household income statistics have been based solely on register data and include all persons in private households living in Norway at the end of the year.
Contact
-
Statistics Norway's Information Centre
E-mail: informasjon@ssb.no
tel.: (+47) 21 09 46 42

