Content
Published:
This is an archived release.
Strong rise in household income in Rogaland and Vest-Agder
Households in Rogaland and Vest-Agder had the strongest increase in real income from 2004 to 2009. Median income after tax rose by 18 per cent in these two counties. In the same period, households in Akershus experienced the lowest income growth by 12 per cent.
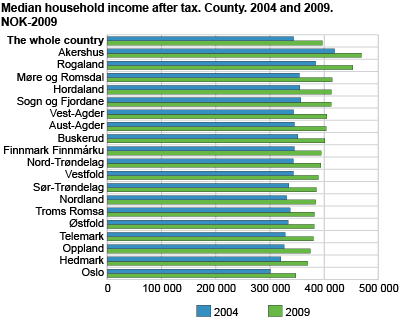
In Norway, median household income after tax increased by about 15 per cent from 2004 to 2009, in 2009-prices. Rogaland and Vest-Agder had the highest income growth by 18 per cent, and the households in these two counties also had the highest increase measured in NOK. Median income after tax in Rogaland was NOK 453 000 in 2009 - up NOK 69 000 since 2004. Households in Vest-Agder increased their median income by NOK 62 000 to NOK 405 000 in 2009. A stronger labour attachment is one of the explanations to the income growth among households in these two counties.
Households in Akershus experienced the lowest real income growth by 12 per cent from 2004 to 2009.
Nevertheless, the median income in Akershus remains the highest in Norway with NOK 469 000 - up NOK 50 000 since 2004.
Underlying dataThe household income statistics include all registered income in cash received by private households in Norway during the calendar year. Since 2004, the household income statistics have been based solely on register data and include all persons in private households living in Norway at the end of the year. The data are described in more detail in About the statistics. |
Tables:
The statistics is published with Income and wealth statistics for households.
Additional information
Some of the figures from households' income geographic distribution are available as open data with API.
The household income statistics include all registered income in cash received by private households in Norway during the calendar year. Since 2004, the household income statistics have been based solely on register data and include all persons in private households living in Norway at the end of the year.
Contact
-
Statistics Norway's Information Centre
E-mail: informasjon@ssb.no
tel.: (+47) 21 09 46 42